Finding the cause of errors that arise when training your model or getting predictions in the cloud can be challenging. This page describes how to find and debug problems you encounter in AI Platform Training. If you encounter problems with the machine learning framework that you are using, read the documentation for the machine learning framework instead.
Command-line tool
ERROR: (gcloud) Invalid choice: 'ai-platform'.This error means that you need to update gcloud. To update gcloud, run the following command:
gcloud components updateERROR: (gcloud) unrecognized arguments: --framework=SCIKIT_LEARN.This error means that you need to update gcloud. To update gcloud, run the following command:
gcloud components updateERROR: (gcloud) unrecognized arguments: --framework=XGBOOST.This error means that you need to update gcloud. To update gcloud, run the following command:
gcloud components updateERROR: (gcloud) Failed to load model: Could not load the model: /tmp/model/0001/model.pkl. '\\x03'. (Error code: 0)This error means the wrong library was used to export the model. To correct this, re-export the model using the correct library. For example, export models of the form
model.pklwith thepicklelibrary and models of the formmodel.joblibwith thejobliblibrary.ERROR: (gcloud.ai-platform.jobs.submit.prediction) argument --data-format: Invalid choice: 'json'.This error means that you specified
jsonas the value of the--data-formatflag when submitting a batch prediction job. In order to use theJSONdata format, you must providetextas the value of the--data-formatflag.
Python versions
ERROR: Bad model detected with error:  "Failed to load model: Could not load the
model: /tmp/model/0001/model.pkl. unsupported pickle protocol: 3. Please make
sure the model was exported using python 2. Otherwise, please specify the
correct 'python_version' parameter when deploying the model. Currently,
'python_version' accepts 2.7 and 3.5. (Error code: 0)"
This error means a model file exported with Python 3 was deployed to an AI Platform Training model version resource with a Python 2.7 setting.
To resolve this:
- Create a new model version resource and set 'python_version' to 3.5.
- Deploy the same model file to the new model version resource.
The virtualenv command isn't found
If you got this error when you tried to activate virtualenv, one possible
solution is to add the directory containing virtualenv to your $PATH
environment variable. Modifying this variable enables you to use virtualenv
commands without typing their full file path.
First, install virtualenv by running the following command:
pip install --user --upgrade virtualenv
The installer prompts you to modify your $PATH environment
variable, and it provides the path to the virtualenv script. On macOS, this
looks similar to
/Users/[YOUR-USERNAME]/Library/Python/[YOUR-PYTHON-VERSION]/bin.
Open the file where your shell loads environment variables. Typically, this is
~/.bashrc or ~/.bash_profile in macOS.
Add the following line, replacing [VALUES-IN-BRACKETS] with the appropriate
values:
export PATH=$PATH:/Users/[YOUR-USERNAME]/Library/Python/[YOUR-PYTHON-VERSION]/bin
Finally, run the following command to load your updated .bashrc
(or .bash_profile) file:
source ~/.bashrc
Using job logs
A good first place to start troubleshooting is the job logs captured by Cloud Logging.
Logging for the different types of operation
Your logging experience varies by the type of operation as shown in the following sections.
Training logs
All of your training jobs are logged. The logs include events from the training service and from your training application. You can put logging events in your application with standard Python libraries (logging, for example). AI Platform Training captures all logging messages from your application. All messages sent to stderr are automatically captured in your job's entry in Cloud Logging.
Batch prediction logs
All of your batch prediction jobs are logged.
Online prediction logs
Your online prediction requests don't generate logs by default. You can enable Cloud Logging when you create your model resource:
gcloud
Include the --enable-logging flag when you run
gcloud ai-platform models create.
Python
Set onlinePredictionLogging to True in the
Model resource you use
for your call to
projects.models.create.
Finding the logs
Your job logs contain all events for your operation, including events from all of the processes in your cluster when you are using distributed training. If you are running a distributed training job, your job-level logs are reported for the master worker process. The first step of troubleshooting an error is typically to examine the logs for that process, filtering out logged events for other processes in your cluster. The examples in this section show that filtering.
You can filter the logs from the command line or in the Cloud Logging section of your Google Cloud console. In either case, use these metadata values in your filter as needed:
| Metadata item | Filter to show items where it is... |
|---|---|
| resource.type | Equal to "cloud_ml_job". |
| resource.labels.job_id | Equal to your job name. |
| resource.labels.task_name | Equal to "master-replica-0" to read only the log entries for your master worker. |
| severity | Greater than or equal to ERROR to read only the log entries corresponding to error conditions. |
Command Line
Use gcloud beta logging read to construct a query that meets your needs. Here are some examples:
Each example relies on these environment variables:
PROJECT="my-project-name"
JOB="my_job_name"
You can enter the string literal in place instead if you prefer.
To print your job logs to screen:
gcloud ai-platform jobs stream-logs $JOB
See all the options for gcloud ai-platform jobs stream-logs.
To print the log for your master worker to screen:
gcloud beta logging read --project=${PROJECT} "resource.type=\"ml_job\" and resource.labels.job_id=${JOB} and resource.labels.task_name=\"master-replica-0\""
To print only errors logged for your master worker to screen:
gcloud beta logging read --project=${PROJECT} "resource.type=\"ml_job\" and resource.labels.job_id=${JOB} and resource.labels.task_name=\"master-replica-0\" and severity>=ERROR"
The preceding examples represent the most common cases of filtering for the logs from your AI Platform Training training job. Cloud Logging provides many powerful options for filtering that you can use if you need to refine your search. The advanced filtering documentation describes those options in detail.
Console
Open the AI Platform Training Jobs page in the Google Cloud console.
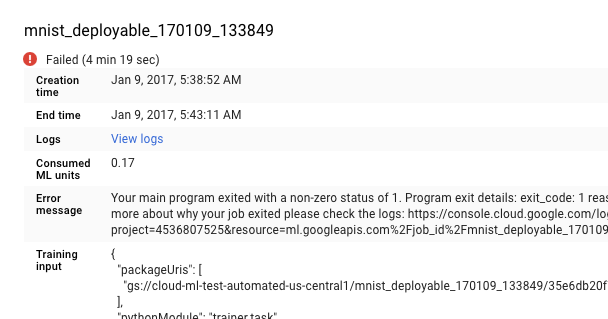
Select the job that failed from the list on the Jobs page to view its details.
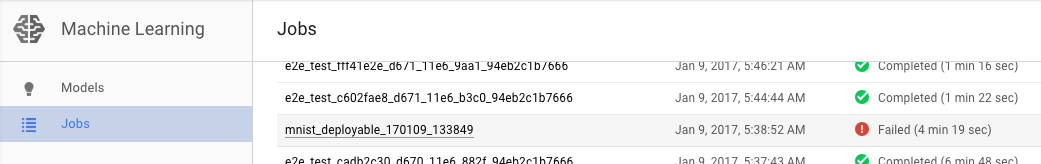
- Click View logs to open Cloud Logging.
You can also go directly to Cloud Logging, but you have the added step of finding your job:
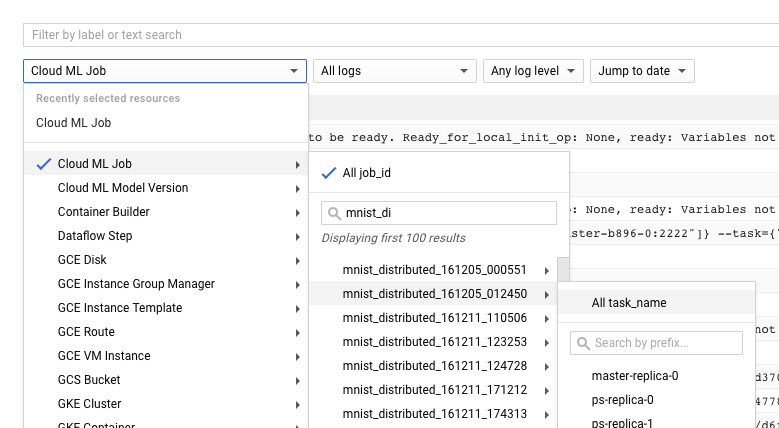
- Expand the resources selector.
- Expand Cloud ML Job in the resources list.
- Find your job name in the job_id list (you can enter the first few letters of the job name in the search box to narrow the jobs displayed).
- Expand the job entry and select
master-replica-0from the task list.
Getting information from the logs
After you have found the right log for your job and filtered it to
master-replica-0, you can examine the logged events to find the source of the
problem. This involves standard Python debugging procedure, but these things
bear remembering:
- Events have multiple levels of severity. You can filter to see just events of a particular level, like errors, or errors and warnings.
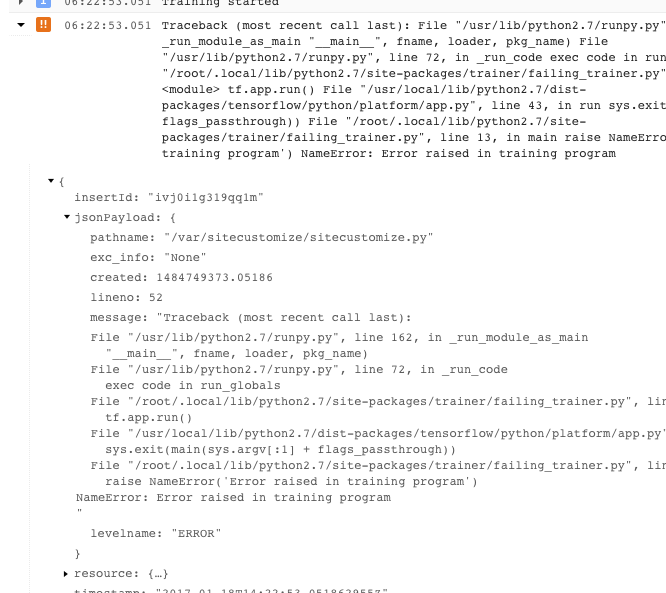
- A problem that causes your trainer to exit with an unrecoverable error condition (return code > 0) is logged as an exception preceded by the stack trace:
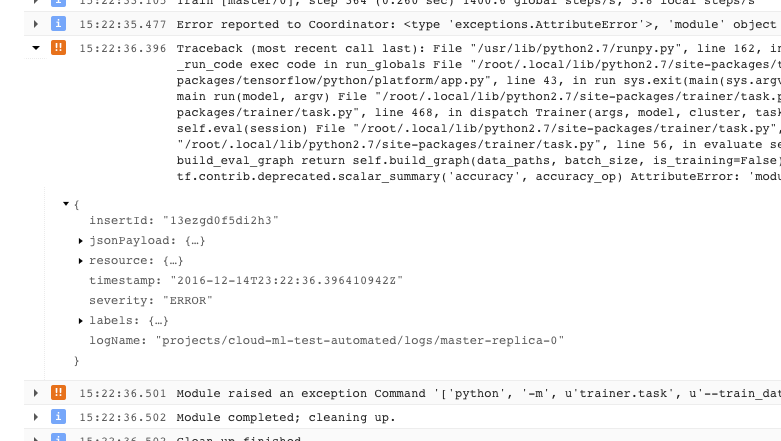
- You can get more information by expanding the objects in the logged JSON message (denoted by a right-facing arrow and contents listed as {...}). For example, you can expand jsonPayload to see the stack trace in a more readable form than is given in the main error description:
- Some errors show instances of retryable errors. These typically don't include a stack trace and can be more difficult to diagnose.
Getting the most out of logging
The AI Platform Training training service automatically logs these events:
- Status information internal to the service.
- Messages your trainer application sends to
stderr. - Output text your trainer application sends to
stdout.
You can make troubleshooting errors in your trainer application easier by following good programming practices:
- Send meaningful messages to stderr (with logging for example).
- Raise the most logical and descriptive exception when something goes wrong.
- Add descriptive strings to your exception objects.
The Python documentation provides more information about exceptions.
Troubleshooting training
This section describes concepts and error conditions that apply to training jobs.
Understanding training application return codes
Your training job in the cloud is controlled by the main program running on the master worker process of your training cluster:
- If you are training in a single process (non-distributed), you only have a single worker, which is the master.
- Your main program is the
__main__function of your TensorFlow training application. - AI Platform Training's training service runs your trainer application until it successfully completes or it encounters an unrecoverable error. This means it may restart processes if retryable errors arise.
The training service manages your processes. It handles a program exit according to the return code of your master worker process:
| Return code | Meaning | AI Platform Training response |
|---|---|---|
| 0 | Successful completion | Shuts down and releases job resources. |
| 1 - 128 | Unrecoverable error | Ends the job and logs the error. |
You don't need to do anything in particular regarding the return code of your
__main__ function. Python automatically returns zero on successful completion,
and returns a positive code when it encounters an unhandled exception. If you
are accustomed to setting specific return codes to your exception objects (a
valid but uncommon practice), it won't interfere with your
AI Platform Training job, as long as you follow the pattern in the table
above. Even so, client code does not typically indicate retryable errors
directly—they come from the operating environment.
Handling specific error conditions
This section provides guidance about some error conditions that are known to affect some users.
Resource exhausted
Demand is high for GPUs and for compute resources in the us-central1 region.
You may get an error message in your job logs that says: Resources are
insufficient in region: <region>. Please try a different region..
To resolve this, try using a different region or try again later.
Trainer runs forever without making any progress
Some situations can cause your trainer application to run continuously while making no progress on the training task. This may be caused by a blocking call that waits for a resource that never becomes available. You can mitigate this problem by configuring a timeout interval in your trainer.
Configure a timeout interval for your trainer
You can set a timeout, in milliseconds, either when creating your session, or when running a step of your graph:
Set the desired timeout interval using the config parameter when you create your Session object:
sess = tf.Session(config=tf.ConfigProto(operation_timeout_in_ms=500))Set the desired timeout interval for a single call to Session.run by using the options parameter:
v = session.run(fetches, options=tf.RunOptions(timeout_in_ms=500))
See the TensorFlow Session documentation for more information.
Program exit with a code of -9
If you get exit code -9 consistently, your trainer application may be using more memory than is allocated for its process. Fix this error by reducing memory usage, using machine types with more memory, or both.
- Check your graph and trainer application for operations that are using more memory than anticipated. Memory usage is affected by the complexity of your data, and the complexity of the operations in your computation graph.
- Increasing the memory allocated to your job may require some finesse:
- If you are using a defined scale tier, you can't increase your memory allocation per machine without adding more machines to the mix. You'll need to switch to the CUSTOM tier and define the machine types in the cluster yourself.
- The precise configuration of each defined machine type is subject to change, but you can make some rough comparisons. You'll find a comparative table of machine types on the training concepts page.
- When testing machine types for the appropriate memory allocation, you might want to use a single machine, or a cluster of reduced size, to minimize the charges incurred.
Program exit with a code of -15
Typically, an exit code of -15 indicates maintenance by the system. It's a retryable error, so your process should be restarted automatically.
Job queued for a long time
If the State of a training
job is QUEUED for an extended period, you may have exceeded your
quota of job requests.
AI Platform Training starts training jobs based on job creation time, using a first-in, first-out rule. If your job is queued, it usually means that all the project quota is consumed by other jobs that were submitted before your job or the first job in the queue requested more ML units/GPUs than the available quota.
The reason that a job has been queued is logged in the training logs. Search the log for messages similar to:
This job is number 2 in the queue and requires
4.000000 ML units and 0 GPUs. The project is using 4.000000 ML units out of 4
allowed and 0 GPUs out of 10 allowed.
The message explains the current position of your job in the queue, and the current usage and quota of the project.
Note that the reason will be logged only for the first ten queued jobs ordered by the job creation time.
If you regularly need more than the allotted number of requests, you can request a quota increase. Contact support if you have a premium support package. Otherwise you can email your request to AI Platform Training feedback .
Quota exceeded
If you get an error with a message like "Quota failure for project_number:...", you may have exceeded one of your resource quotas. You can monitor your resource consumption and request an increase on the AI Platform Training quotas page in your console's API Manager.
Invalid save path
If your job exits with an error message that includes "Restore called with invalid save path gs://..." you may be using an incorrectly configured Google Cloud Storage bucket.
Open the Google Cloud Storage Browser page in the Google Cloud console.
Check the Default storage class for the bucket you're using:
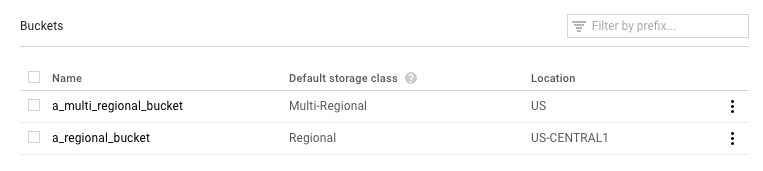
- It should be Regional. If it is, then something else went wrong. Try running your job again.
- If it is Multi-Regional, you need to either change it to Regional, or move your training materials to a different bucket. For the former, find instructions for changing a bucket's storage class in the Cloud Storage documentation.
Trainer exits with AbortedError
This error can occur if you are running a trainer that uses TensorFlow Supervisor to manage distributed jobs. TensorFlow sometimes throws AbortedError exceptions in situations where you shouldn't halt the entire job. You can catch that exception in your trainer and respond accordingly. Note that TensorFlow Supervisor is not supported in trainers you run with AI Platform Training.
Troubleshooting prediction
This section gathers some common issues encountered when getting predictions.
Handling specific conditions for online prediction
This section provides guidance about some online prediction error conditions that are known to affect some users.
Predictions taking too long to complete (30-180 seconds)
The most common cause of slow online prediction is scaling processing nodes up from zero. If your model has regular prediction requests made against it, the system keeps one or more nodes ready to serve predictions. If your model hasn't served any predictions in a long time, the service "scales down" to zero ready nodes. The next prediction request after such a scale-down will take much more time to return than usual because the service has to provision nodes to handle it.
HTTP status codes
When an error occurs with an online prediction request, you usually get an HTTP status code back from the service. These are some commonly encountered codes and their meaning in the context of online prediction:
- 429 - Out of Memory
The processing node ran out of memory while running your model. There is no way to increase the memory allocated to prediction nodes at this time. You can try these things to get your model to run:
- Reduce your model size by:
- Using less precise variables.
- Quantizing your continuous data.
- Reducing the size of other input features (using smaller vocab sizes, for example).
- Send the request again with a smaller batch of instances.
- Reduce your model size by:
- 429 - Too many pending requests
Your model is getting more requests than it can handle. If you are using auto-scaling, it is getting requests faster than the system can scale up.
With auto-scaling, you can try to resend requests with exponential backoff. Doing so can give the system time to adjust.
- 429 - Quota
Your Google Cloud Platform project is limited to 10,000 requests every 100 seconds (about 100 per second). If you get this error in temporary spikes, you can often retry with exponential backoff to process all of your requests in time. If you consistently get this code, you can request a quota increase. See the quota page for more details.
- 503 - Our systems have detected unusual traffic from your computer network
The rate of requests your model has received from a single IP is so high that the system suspects a denial of service attack. Stop sending requests for a minute and then resume sending them at a lower rate.
- 500 - Could not load model
The system had trouble loading your model. Try these steps:
- Ensure that your trainer is exporting the right model.
- Try a test prediction with the
gcloud ai-platform local predictcommand. - Export your model again and retry.
Formatting errors for prediction requests
These messages all have to do with your prediction input.
- "Empty or malformed/invalid JSON in request body"
- The service couldn't parse the JSON in your request or your request is empty. Check your message for errors or omissions that invalidate JSON.
- "Missing 'instances' field in request body"
- Your request body doesn't follow the correct format. It should be a JSON
object with a single key named
"instances"that contains a list with all of your input instances. - JSON encoding error when creating a request
Your request includes base64 encoded data, but not in the proper JSON format. Each base64 encoded string must be represented by an object with a single key named
"b64". For example:{"b64": "an_encoded_string"}Another base64 error occurs when you have binary data that isn't base64 encoded. Encode your data and format it as follows:
{"b64": base64.b64encode(binary_data)}See more information on formatting and encoding binary data.
Prediction in the cloud takes longer than on the desktop
Online prediction is designed to be a scalable service that quickly serves a high rate of prediction requests. The service is optimized for aggregate performance across all of the serving requests. The emphasis on scalability leads to different performance characteristics than generating a small number of predictions on your local machine.
What's next
- Get support.
- Learn more about the Google APIs error model,
in particular the canonical error codes defined in
google.rpc.Codeand the standard error details defined in google/rpc/error_details.proto. - Learn how to monitor your training jobs.
- See the Cloud TPU troubleshooting and FAQ for help diagnosing and solving problems when running AI Platform Training with Cloud TPU.