Bitcoin in BigQuery: blockchain analytics on public data
Allen Day
Developer Advocate, Digital Assets at Google Cloud
Colin Bookman
Cloud Customer Engineer
Cryptocurrencies have captured the imagination of technologists, financiers, and economists. Perhaps even more intriguing are the long-term, diverse applications of the blockchain. By increasing transparency of cryptocurrency systems, the contained data becomes more accessible and useful.
The Bitcoin blockchain data are now available for exploration with BigQuery. All historical data are in the bigquery-public-data:bitcoin_blockchain dataset, which updates every 10 minutes.
We hope that by making the data more transparent, users of the data can gain a deeper understanding of how cryptocurrency systems function and how they might best be used for the benefit of society.
Interesting Queries and Analyses
Below, we show a number of interesting queries and visualizations based on the Bitcoin dataset. Our analyses focus on two popular topics:- network fundamentals (block difficulty)
- transaction visualization (first goods purchase)
Aggregate blockchain network statistics
Bitcoin network properties provide a basis for fundamental valuation of the network. For example, the total number of Bitcoins sent per day and the total number of Bitcoin recipients per day indicate economic activity on-network, and are related to Bitcoin’s value per Metcalfe’s Law, the conjecture that the value of a network is proportional to the square of the number of users.This interactive chart shows the number of Bitcoins transacted per day across the network over time:
This interactive chart shows the number of recipient addresses per day over time:
See below for a valuation metric developed from first principles for blockchain networks, the Network Value to Transactions Ratio, or NVT Ratio. This chart show the daily NVT Ratio over time:
Other properties of the Bitcoin network, such as the difficulty parameter of the Bitcoin mining algorithm, may also be of fundamental economic importance. The following chart shows the relationship of Bitcoin mining difficulty vs. search volume for “Bitcoin”.
Transaction visualization
One consequence of using electronic currency to conduct commerce is that it becomes possible to record transactions publicly with perfect fidelity. On May 17, 2010, the first known exchange of Bitcoin for goods took place. Laszlo Hanyecz purchased two pizzas for 10,000 BTC, and the transaction from address 1XPT…rvH4 to address 17Sk…xFyQ is recorded in the blockchain with transaction ID a107…d48d. We produced a data visualization of input transfers to Hanyecz’s address preceding the pizza purchase by up to 4 degrees. Here’s the code we used to generate a plot like the one below. Hanyecz’s payment address is depicted as a red circle while other addresses are blue circles. Arrowheads indicate direction of Bitcoin flow preceding the pizza purchase transaction. Stroke width is approximately proportional to the amount of Bitcoin moving between addresses.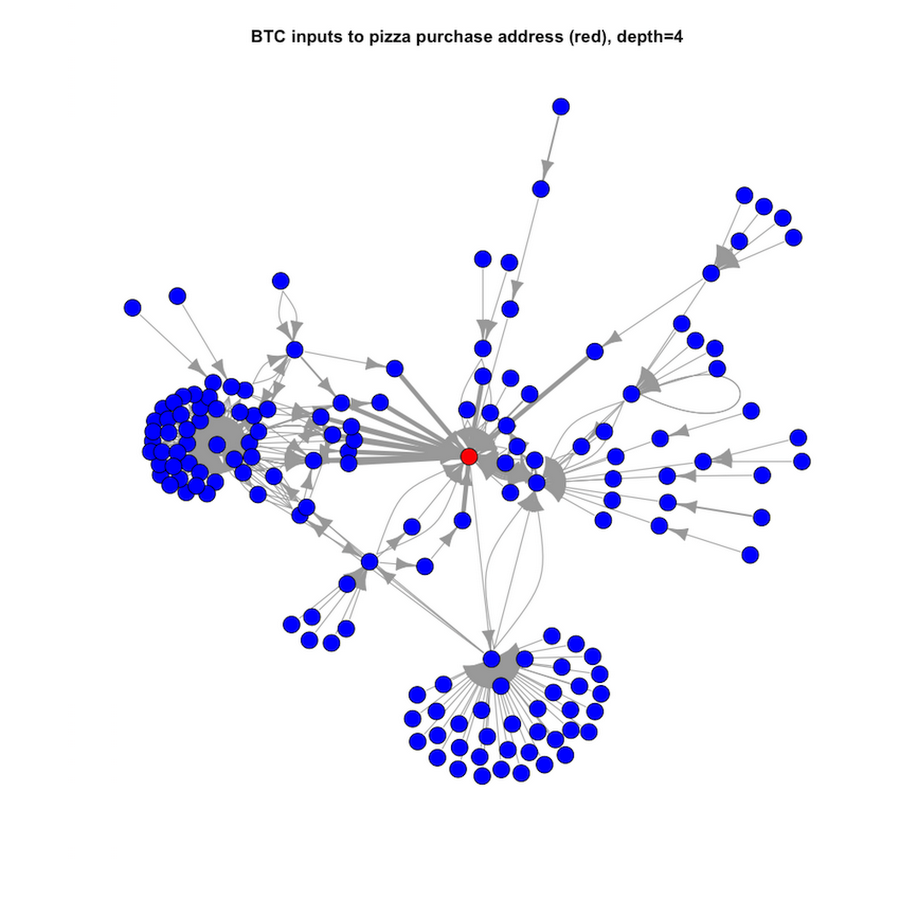
Blockchain exploration and anomaly detection
In the Bitcoin blockchain there exists a transaction which was added to two blocks. This shouldn’t be possible. The anomalous transaction can be uncovered with this query:How did this happen? Bitcoin was first built with BerkeleyDB, which can handle non-unique keys. After Satoshi Nakamoto left the Bitcoin project, a new development team replaced BerkeleyDB with LevelDB. LevelDB cannot handle unique keys, causing the developers to modify the Bitcoin source code by implementing Bitcoin Improvement Proposal BIP_0030.
Even though it’s no longer possible for a transaction to exist in multiple blocks, there are still a few older transactions where this happened.
Why is it useful to have Bitcoin Blockchain Data accessible on Google Cloud?
Blockchains in general provide a solution for communication and coordination amongst peers in low-trust environments. Use cases are emerging in the financial services, supply chain, media, and other highly digitized industries. The Bitcoin blockchain in particular aims to remedy financial industry flaws, as documented in the Bitcoin genesis block by Satoshi Nakamoto.Bitcoin can be described as an immutable distributed ledger, and while it provides OLTP capabilities (atomic transactions, data durability), it has very limited OLAP (analytics) capability for regularly required short time-scale reporting on specific or aggregated money flows stored in the ledger. Inability to easily build reports from the blockchain can reduce transparency and increase the difficulty of price discovery of BTC-USD, as well as other fundamental metrics of valuation such as the NVT Ratio.
In contrast, BigQuery has strong OLAP capabilities. We built a software system on Google Cloud that:
- performs a real-time extraction of data from the Bitcoin blockchain ledger
- stores the data to BigQuery and de-normalizes it to make exploration easier
- derives insights from the extracted data with Data Studio