Tambahkan kebijakan
SpikeArrest ke proxy Anda. Kebijakan SpikeArrest adalah kebijakan yang
membatasi jumlah permintaan yang dapat dikirim ke proxy API Anda.
Proxy Anda harus memiliki setidaknya satu
kebijakan.
Melihat data pesan
Tampilan Debug di Editor Proxy Apigee memungkinkan Anda melihat header, variabel, objek, dan detail lainnya seperti waktu respons dalam alur permintaan dan respons proxy API. Tampilan Debug juga memungkinkan Anda melihat bagaimana permintaan atau
respons berubah saat diproses oleh proxy API. Untuk deskripsi yang lebih mendetail tentang tampilan debug, lihat Menggunakan Debug.
Halaman ini menjelaskan cara menggunakan tampilan Debug untuk melihat apa yang terjadi saat
tingkat kebijakan SpikeArrest terlampaui.
UI Konsol Cloud
Debug v2 (baru)
Untuk menggunakan tampilan Debug di UI Konsol Cloud guna melihat apa yang terjadi saat batas laju kebijakan SpikeArrest terlampaui:
Pilih Lingkungan tempat Anda ingin menjalankan
sesi debug.
(Opsional) Dari menu drop-down Filter, pilih
filter yang akan diterapkan ke semua transaksi dalam sesi debug yang
Anda buat. Nilai defaultnya adalah None (All
transactions), yang mencakup semua transaksi dalam
data debug.
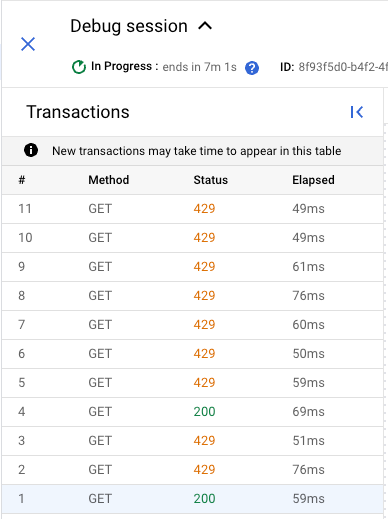
Panggil proxy API menggunakan curl (atau dengan URL di browser
web) beberapa kali hingga Anda melihat setidaknya satu respons 200
dan satu respons 429 di panel
Transaksi.
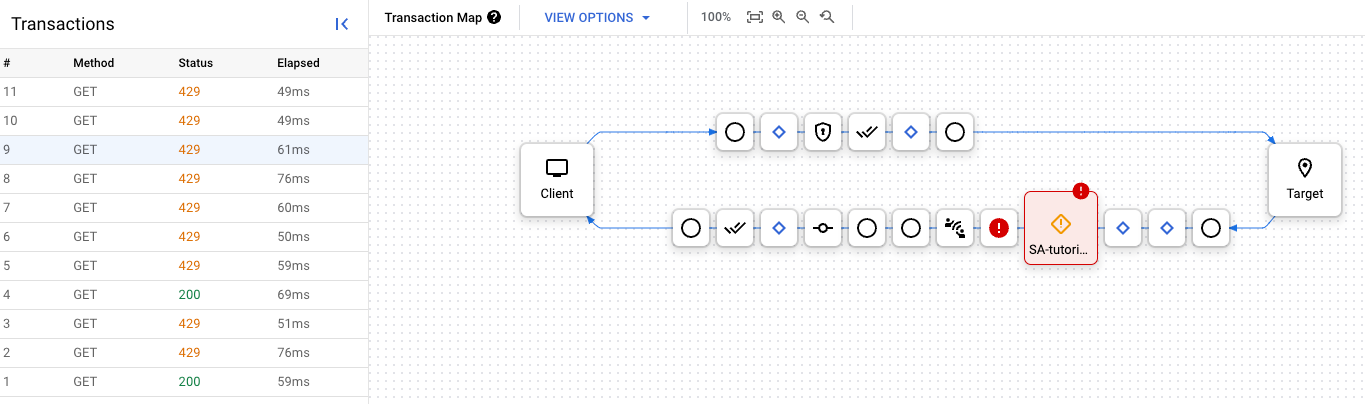
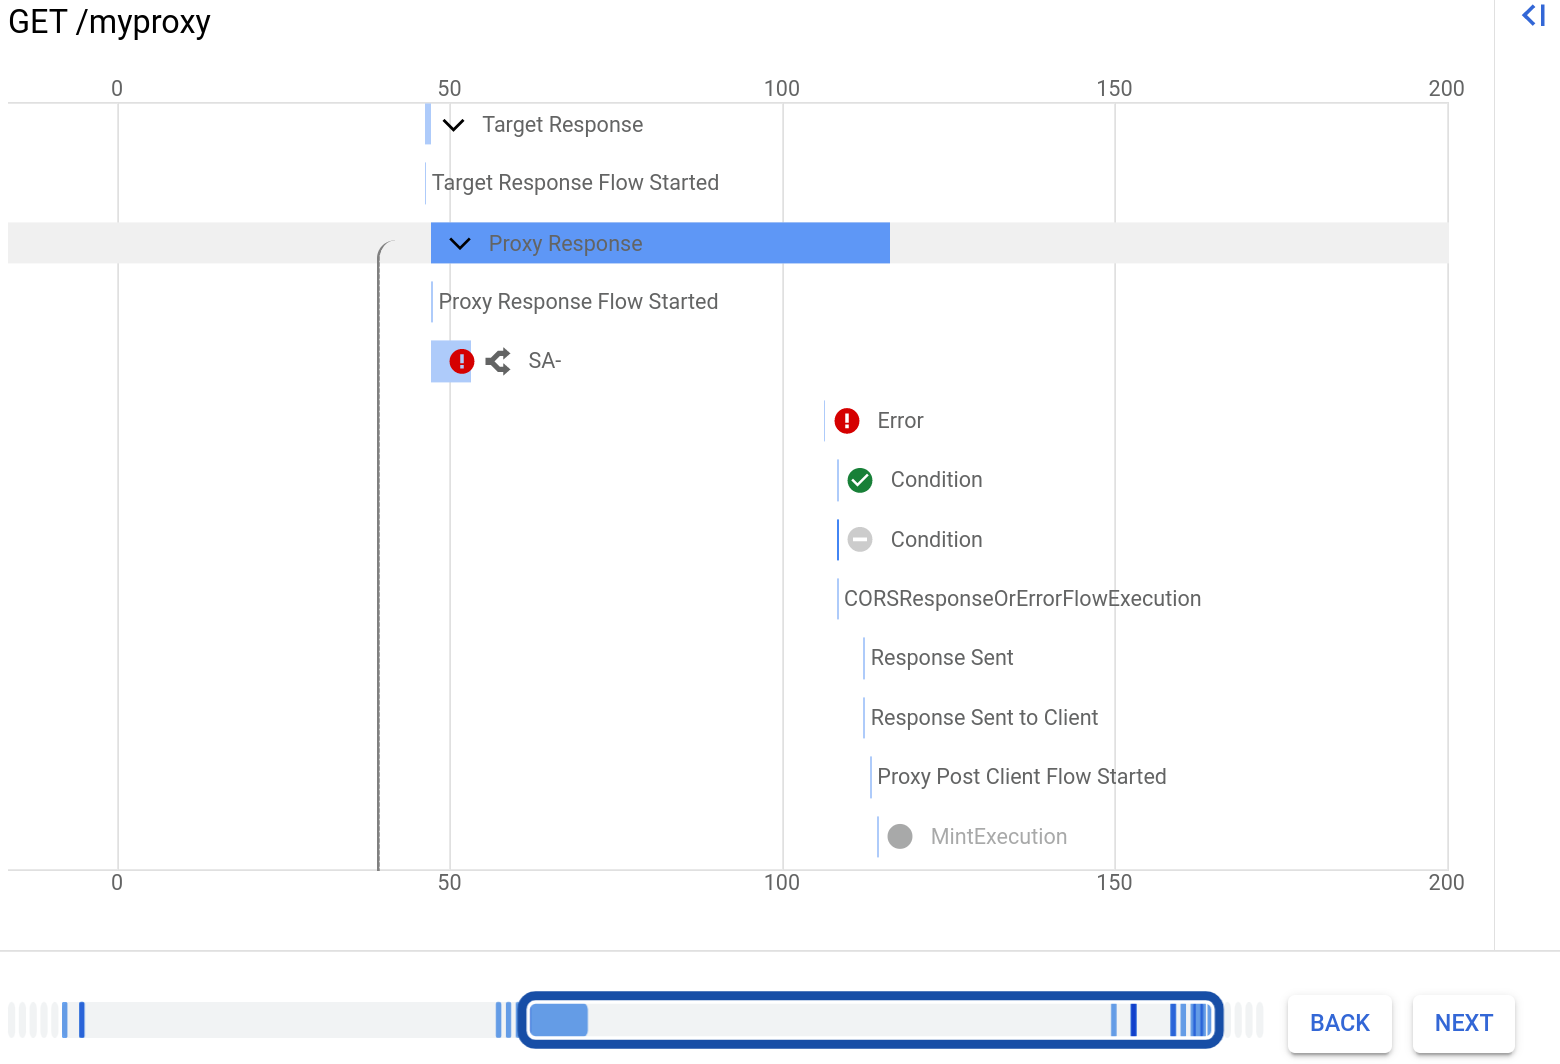
Klik transaksi 429. Di panel Peta transaksi, diagram alur ini menampilkan kebijakan SpikeArrest dengan ikon error.
Anda dapat mengklik tombol
navigate_beforeSebelumnya dan
navigate_nextBerikutnya untuk berpindah antar-langkah dalam alur dan melihat
detail setiap langkah.
Untuk mendownload seluruh sesi debug sebagai satu dokumen, klik
Download Sesi. Sesi debug akan dihapus dalam waktu 24 jam
setelah selesai, jadi jika Anda ingin melihat sesi setelah
waktu tersebut, Anda harus mendownloadnya sebelum waktu tersebut.
Debug v1
Di tab Develop pada Proxy API, edit
<Rate> kebijakan Spike Arrest menjadi 1pm lagi, lalu
Save proxy. Dengan begitu, Anda dapat melihat panggilan API yang berhasil dan gagal (melebihi batas).
Di Editor Proxy, klik tab Debug.
Klik Start Debug Session.
Dalam dialog:
Pilih Lingkungan tempat Anda ingin menjalankan sesi debug.
(Opsional) Dari menu drop-down Filter, pilih filter yang akan diterapkan ke
semua transaksi dalam sesi debug yang Anda buat.
Nilai defaultnya adalah None (All transactions), yang mencakup semua transaksi
dalam data debug.
Panggil API
proxy lagi menggunakan curl (atau dengan URL di browser web) beberapa kali
hingga Anda melihat
setidaknya satu respons 200 dan satu respons 429 di panel sebelah kiri.
Klik transaksi 429 di panel sebelah kiri. Bagian ini menampilkan
diagram Gantt
untuk transaksi di panel sebelah kanan.
Perhatikan bahwa ada baris untuk kebijakan Pembatasan Lonjakan, yang ditampilkan dengan ikon error.
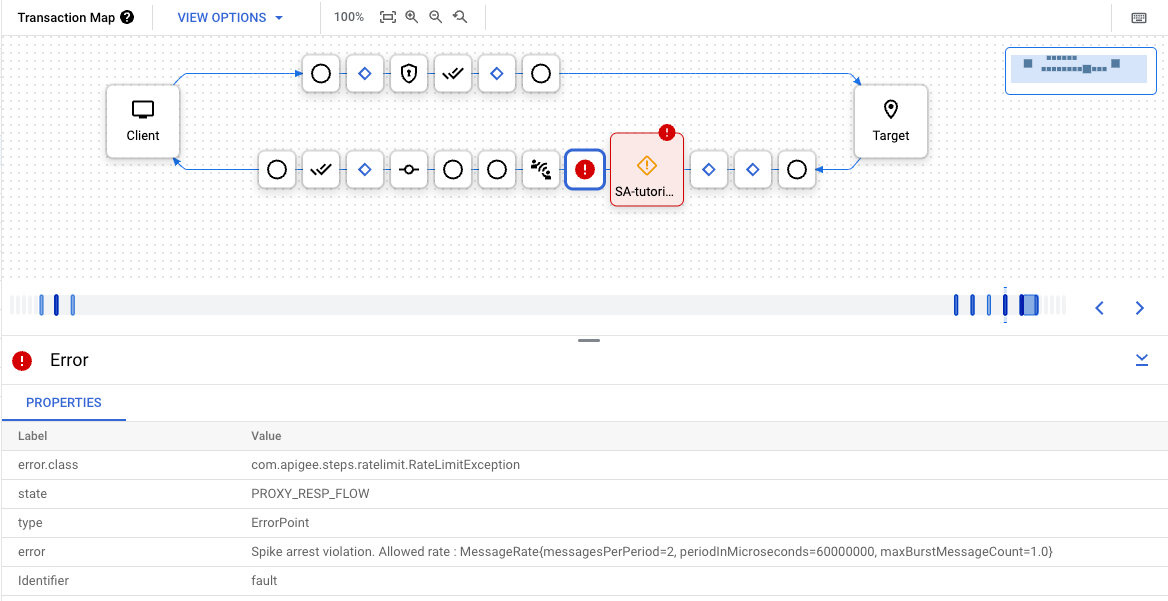
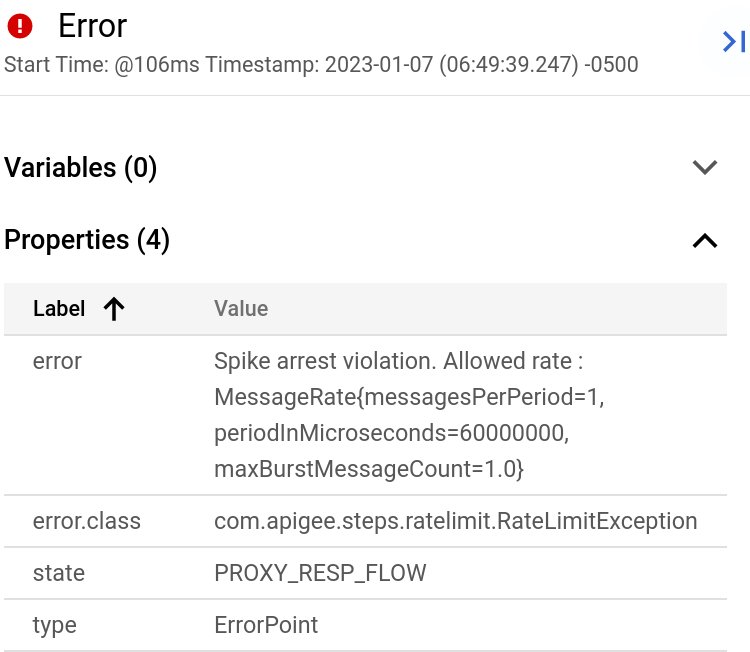
Klik baris berlabel Error. Bagian ini menampilkan detail error di sebelah kanan diagram. Gambar di bawah menunjukkan bagian Properti dari detail error:
Anda dapat mengklik tombol Kembali dan Berikutnya di bawah diagram
Gantt untuk berpindah antar-langkah dalam alur dan melihat detail setiap langkah.
Untuk mendownload seluruh sesi debug sebagai satu dokumen, klik
Download Sesi.
Sesi debug dihapus dalam waktu 24 jam setelah selesai, jadi jika
Anda ingin melihat sesi setelah waktu tersebut, Anda harus mendownloadnya sebelum waktu tersebut.
UI Klasik
Di tab Develop pada proxy API, edit
<Rate> kebijakan Spike Arrest menjadi 1pm lagi, lalu
Save proxy. Dengan begitu, Anda dapat melihat panggilan API yang berhasil dan gagal (melebihi batas).
Di Editor Proxy, klik tab Debug.
Di bagian Mulai sesi debug, pilih lingkungan tempat proxy Anda
di-deploy.
Klik Start Debug Session.
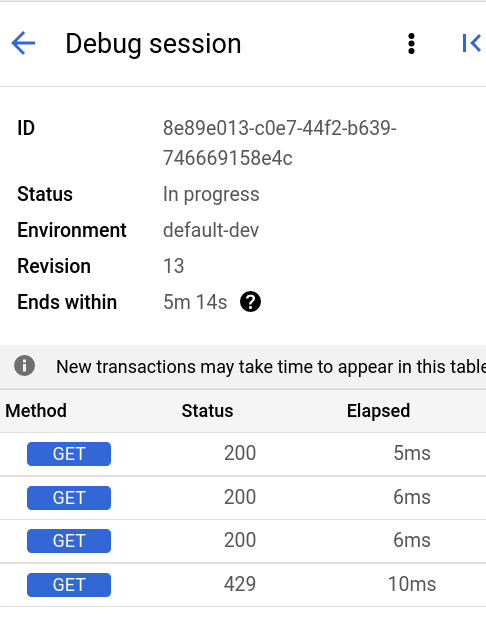
Panggil proxy API lagi menggunakan curl (atau dengan URL di browser web) hingga Anda melihat setidaknya satu respons 200 dan satu respons 429 di panel Debug Transaksi.
Klik transaksi 200 di panel Transaksi di sebelah kiri. Detail
Debug-nya dimuat di jendela utama pada bagian Peta Transaksi, yang menampilkan diagram
permintaan/respons. Ikon Spike Arrest ada dalam alur permintaan.
Dalam diagram alur, klik ikon lingkaran dalam respons, yang
paling kanan (ditampilkan dalam diagram berikut).
Panel Detail Fase menampilkan data yang tersedia pada titik tersebut dalam
alur. Jika men-scroll panel tersebut, Anda akan melihat header respons HTTP dan konten isi.
Sekarang, lihat error di Debug.
Klik transaksi 429 di panel Transaksi. Di jendela
editor utama, Anda akan melihat diagram alur dengan item hanya dalam permintaan, termasuk ikon
Spike Arrest dengan tanda seru merah yang menunjukkan error.
Klik ikon error kecil berbentuk tabung di sebelah kanan ikon Spike Arrest, dan
lihat detail pelanggaran spike arrest di panel Phase Details.
Anda dapat mengklik tombol Kembali dan Berikutnya dalam diagram
alur untuk berpindah antar-titik dalam alur dan melihat detail Debug.
Jika Anda ingin melihat seluruh sesi Debug sebagai satu dokumen, download dengan mengklik
Download Sesi Debug.
[[["Mudah dipahami","easyToUnderstand","thumb-up"],["Memecahkan masalah saya","solvedMyProblem","thumb-up"],["Lainnya","otherUp","thumb-up"]],[["Sulit dipahami","hardToUnderstand","thumb-down"],["Informasi atau kode contoh salah","incorrectInformationOrSampleCode","thumb-down"],["Informasi/contoh yang saya butuhkan tidak ada","missingTheInformationSamplesINeed","thumb-down"],["Masalah terjemahan","translationIssue","thumb-down"],["Lainnya","otherDown","thumb-down"]],["Terakhir diperbarui pada 2025-09-04 UTC."],[[["\u003cp\u003eThis tutorial teaches you how to use the Apigee Debug view to examine API proxy request and response flows, including headers, variables, objects, and response time.\u003c/p\u003e\n"],["\u003cp\u003eYou will learn to identify error messages, specifically when the SpikeArrest policy rate is exceeded, by observing the HTTP 429 status code in transactions within the Debug view.\u003c/p\u003e\n"],["\u003cp\u003eThe guide includes steps for configuring the SpikeArrest policy's rate to 1pm, enabling you to observe both successful (200) and rate-exceeded (429) responses in the debug session.\u003c/p\u003e\n"],["\u003cp\u003eDebug sessions can be downloaded as single documents for later review, but note that sessions are automatically deleted after 24 hours.\u003c/p\u003e\n"],["\u003cp\u003eThe Debug Tool is available in the Google Cloud console, Classic UI, with different versions and some actions can be performed using the API.\u003c/p\u003e\n"]]],[],null,["# View message data with the Debug view\n\n*This page\napplies to **Apigee** and **Apigee hybrid**.*\n\n\n*View [Apigee Edge](https://docs.apigee.com/api-platform/get-started/what-apigee-edge) documentation.*\n\n**What you'll learn**\n\nIn this tutorial, you'll learn to:\n\n- See the response message's headers and body content.\n- See error messages.\n\n**What you'll need**\n\nBefore you begin this tutorial, do the following:\n\n- Ensure that [`curl`](https://curl.haxx.se/) is installed on your machine to make API calls from the command line.\n- Complete the steps in [Before you begin](/apigee/docs/api-platform/get-started/overview).\n- Add a [SpikeArrest policy to your proxy](/apigee/docs/api-platform/tutorials/add-spike-arrest). The SpikeArrest policy is a policy that restricts the number of requests that can be sent to your API proxy. Your proxy must have at least one [policy](/apigee/docs/api-platform/get-started/add-policy).\n\nView message data\n-----------------\n\n\nThe Debug view in the Apigee Proxy Editor lets you view headers, variables,\nobjects, and other details such as response time in the API proxy request\nand response flow. The Debug view also lets you see how a request or\nresponse changes as it is processed by an API proxy. For a more detailed\ndescription of the debug view, see\n[Using Debug](/apigee/docs/api-platform/debug/trace).\n\n\nThis page describes how to use the Debug view to see what happens when the\nSpikeArrest policy rate is exceeded.\n**Note:** The Debug Tool is available in the Google Cloud console, the Classic UI, and some debug actions can be performed using the API as described in the following tabs. The Google Cloud console options are Debug v2 (new) and Debug v1 (released [07/01/2022](/apigee/docs/api-platform/release-notes#July_01_2022)). You can switch between versions of the Debug Tool in the Google Cloud console and the Classic UI. \n\n### Cloud Console UI\n\n### Debug v2 (new)\n\n\nTo use the Debug view in the Cloud Console UI to see what happens\nwhen the SpikeArrest policy rate is exceeded:\n\n1. Open the [Cloud Console UI](https://console.cloud.google.com/apigee).\n2. Select your project.\n3. Click **Proxy development \\\u003e API Proxies**.\n4. Click the name of the API proxy you want to debug.\n5. Click the **Develop** tab.\n6. Click the **Policies \\\u003e SpikeArrest** policy.\n7. In the edit pane, change **Rate** to **1pm**.\n8. Click **Save**.This will allow you to see both successful and failed (over the limit) API calls.\n9. [Deploy](/apigee/docs/api-platform/deploy/ui-deploy-new) the updated proxy.\n10. Click the **Debug** tab.\n11. Click **Start Debug Session** .\n\n In the dialog:\n 1. Select the **Environment** in which you want to run the debug session.\n 2.\n (Optional) From the **Filter** drop-down list, select a\n filter to apply to all transactions in the debug session you\n are creating. The default is `None (All\n transactions)`, which includes all transactions in the\n debug data.\n\n\n For information on using filters, see\n [Using filters in a debug session](/apigee/docs/api-platform/debug/trace#debugsession-filter).\n For information about the built-in filters, see\n [Using predefined filters](/apigee/docs/api-platform/debug/trace#predefined-filters).\n 3. Click **Start**.\n12.\n [Call the API](/apigee/docs/api-platform/get-started/test-proxy) proxy using `curl` (or with the URL in a web\n browser) several times until you see at least one `200`\n response and one `429` response in the\n **Transactions** pane.\n\n | **Note:** The HTTP status code for exceeding the rate limit is `429 Too many requests`.\n13.\n Click a `429` transaction. In the **Transaction map**\n pane, this displays a flow diagram including a SpikeArrest policy\n with an error icon.\n\n14.\n Click the error\n **error** icon. The **Error Properties** pane is displayed.\n\n\nYou can click the\nnavigate_before\n**Previous** and\nnavigate_next\n**Next** buttons to move between steps in the flow and see the\ndetails of each step.\n\n\nTo download the entire debug session as a single document, click\n**Download Session**. A debug session is deleted within 24 hours\nof the time it is completed, so if you want to view the session after\nthat time, you need to download it before then.\n\n### Debug v1\n\n1. On the **Develop** tab of the API Proxy, edit the Spike Arrest policy's **\u003cRate\u003e** to be **1pm** again, then **Save** the proxy. This will allow you to see both successful and failed (over the limit) API calls.\n2. In the Proxy Editor, click the **Debug** tab.\n3. Click **Start Debug Session**.\n4. In the dialog:\n 1. Select the **Environment** in which you want to run the debug session.\n 2. (Optional) From the **Filter** drop-down list, select a filter to apply to all transactions in the debug session you are creating. The default is `None (All transactions)`, which includes all transactions in the debug data.\n\n For information on using filters, see [Using filters in a debug session](#debugsession-filter).\n For information about the built-in filters, see [Using predefined filters](#predefined-filters).\n 3. Click **Start**.\n5. [Call the API](/apigee/docs/api-platform/get-started/test-proxy)\n proxy again using `curl` (or with the URL in a web browser) several times\n until you see\n at least one `200` response and one `429` response in the left-hand pane.\n\n | **Note:** The HTTP status code for exceeding the rate limit is `429 Too many requests`.\n6. Click the `429` transaction in the left-hand pane. This displays a [Gantt chart](https://en.wikipedia.org/wiki/Gantt_chart) for the transaction in the right-hand pane.\n\n Note that there is a row for the Spike Arrest policy, which is displayed with an error icon.\n7. Click the row labeled **Error** . This displays the error details to the\n right of the chart. The picture below shows the **Properties** section of the error details:\n\nYou can click the **Back** and **Next** buttons below the Gannt\nchart to move between steps in the flow and see the details of each step.\n\nTo download the entire debug session as a single document, click\n**Download Session**.\nA debug session is deleted within 24 hours of the time it is completed, so if\nyou want to view the session after that time, you need to download it before then.\n\n### Classic UI\n\n1. On the **Develop** tab of the API proxy, edit the Spike Arrest policy's **\u003cRate\u003e** to be **1pm** again, then **Save** the proxy. This will allow you to see both successful and failed (over the limit) API calls.\n2. In the Proxy Editor, click the **Debug** tab.\n3. Under **Start a debug session**, select the environment to which your proxy is deployed.\n4. Click **Start Debug Session**.\n5. Call the API proxy again using `curl` (or with the URL in a web browser) until you see\n at least one `200` response and one `429` response in the **Debug Transactions** pane.\n\n ```\n curl -v https://YOUR_ENV_GROUP_HOSTNAME/my-proxy\n ```\n\n where \u003cvar translate=\"no\"\u003eYOUR ENV_GROUP_HOSTNAME\u003c/var\u003e is the environment group hostname. See\n [Find the environment group hostname](/apigee/docs/api-platform/get-started/test-proxy#find-the-environment-group-hostname).\n\n A `200` response and a `429` response are shown below.\n\n | **Note:** The default HTTP status code for exceeding the rate limit is `429 Too many requests`.\n |\n | If you want the status code to be different (`500`, for example) for all Spike Arrest policies used in an\n | organization, a property needs to be set on your organization. If you're a Cloud customer,\n | contact [Google Cloud Customer Care](https://cloud.google.com/support-hub/) to set that property.\n6. Click the `200` transaction in the left **Transactions** pane. Its Debug detail is loaded in the main window under **Transaction Map**, which shows a request/response diagram. The Spike Arrest icon is in the request flow.\n7. In the flow diagram, click the **circle icon** in the response, the furthest one to the right (shown in the following diagram).\n\n The **Phase Details** pane shows the data available at that point in the\n flow. If you scroll through that pane, you'll see the HTTP response headers and body\n content.\n8. Now look at an error in Debug. Click the `429` transaction in the Transactions pane. In the main editor\n window, you see a flow diagram with items in the request only, including a Spike Arrest\n icon with a red exclamation point indicating an error.\n\n Click the small tube-shaped **error icon** to the right of the Spike Arrest icon, and\n look at the spike arrest violation details in the **Phase Details** pane.\n\nYou can click the **Back** and **Next** buttons in the flow\ndiagram to move between points in the flow and see the Debug details.\n\nIf you want to see the entire Debug session as a single document, download it by clicking\n**Download Debug Session**.\n\nFor more information, see [Using Debug](/apigee/docs/api-platform/debug/trace)."]]