curl instalado na máquina para fazer chamadas de API a partir da linha de comando.
Ver dados da mensagem
A visualização de depuração no editor de proxy da Apigee permite visualizar cabeçalhos, variáveis, objetos e outros detalhes, como
o tempo de resposta na solicitação de proxy de API e no fluxo de resposta. A ferramenta de depuração também permite ver
como uma solicitação ou uma resposta é alterada conforme é processada por um proxy de API. Para ver uma descrição mais detalhada da visualização de depuração, consulte Como usar a depuração.
No tutorial anterior, você restringiu
o número de solicitações com a política SpikeArrest. Esta página descreve como usar a visualização de depuração para ver o que acontece quando essa taxa é excedida.
Novo Editor de Proxy
Na guia Desenvolver do proxy da API, edite o <Rate> da política do Speike Arrest para 1pm e depois clique em Salvar o proxy. Com isso, você poderá ver chamadas de API bem-sucedidas e com falha (acima
do limite).
No editor de proxy, clique na guia Depuração.
Clique em Iniciar sessão do Debug.
Na caixa de diálogo, faça o seguinte:
Selecione o Ambiente em que você quer executar a sessão de depuração.
Opcional: na lista suspensa Filtrar, selecione um filtro a ser aplicado
a todas as transações na sessão de depuração que você está criando.
O padrão é None (All transactions), que inclui todas as transações
nos dados de depuração.
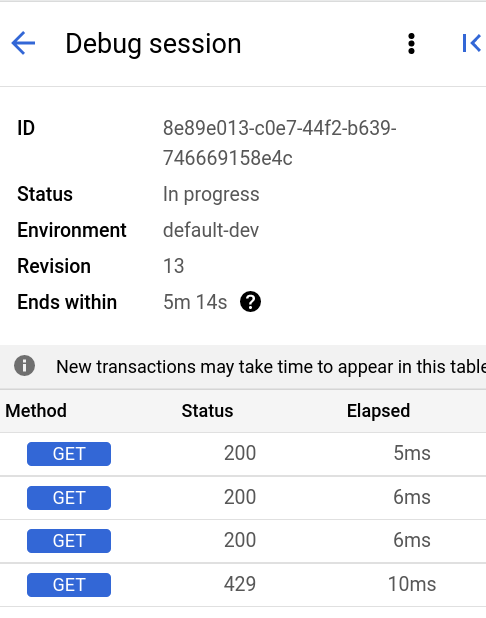
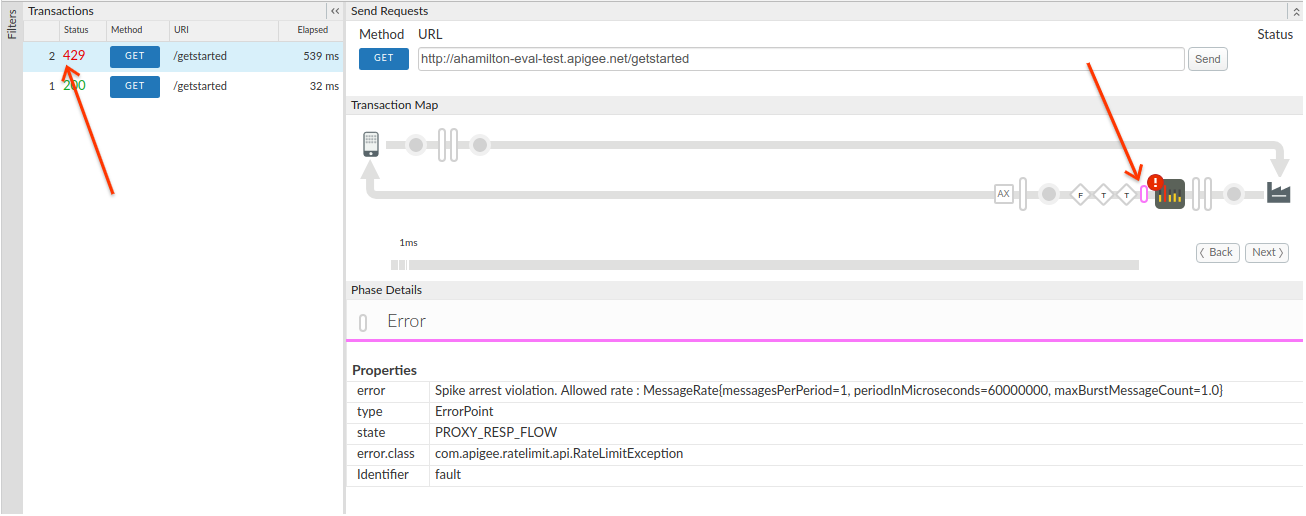
Chamar o proxy de API novamente usando curl (ou o URL em um navegador da Web) várias vezes até ver pelo menos uma resposta 200 e Uma resposta 429 no painel à esquerda.
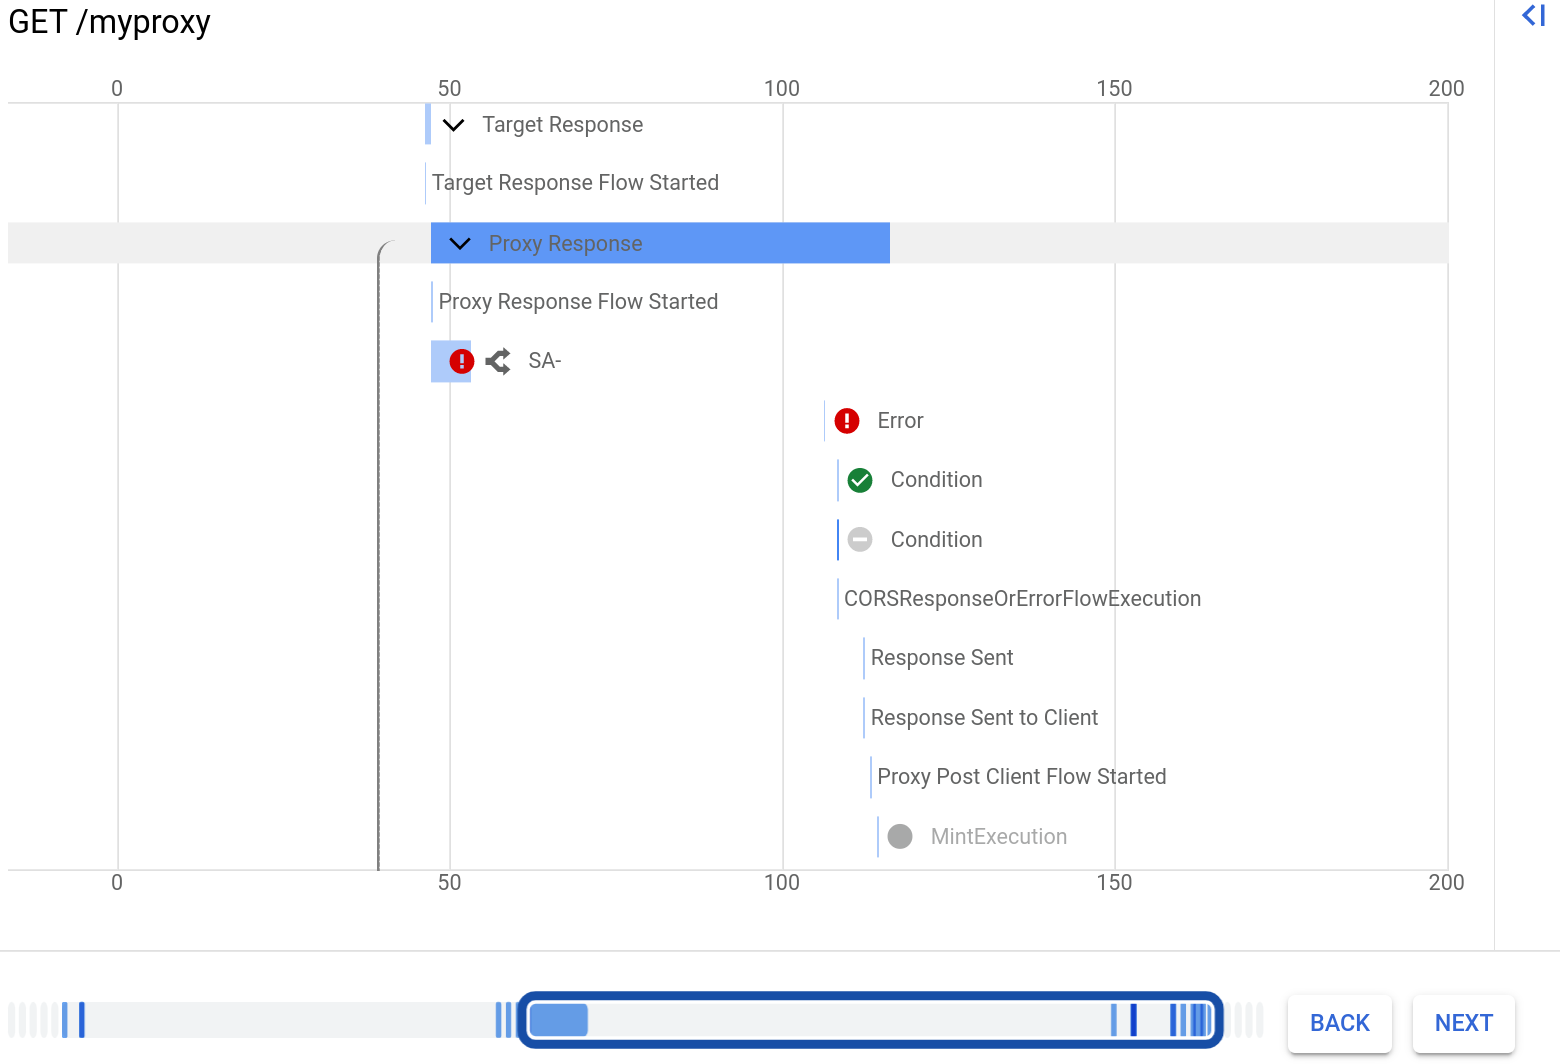
Clique na transação 429 no painel Transações à esquerda. Isso exibirá um
gráfico de Gantt
para a transação no painel à direita.
Observe que há uma linha para a política Spike Arrest, que é exibida com um ícone de erro.
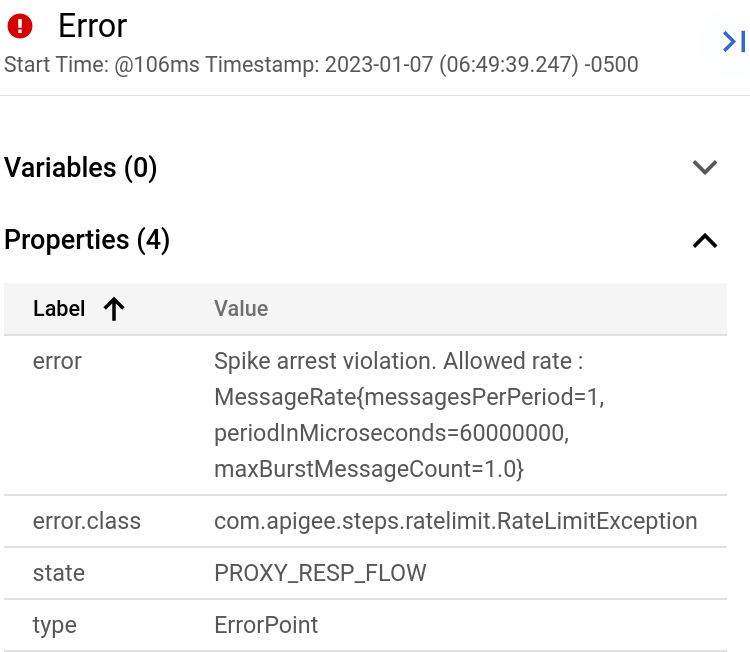
Clique na linha Erro. Os detalhes do erro serão exibidos à direita do gráfico. A imagem abaixo mostra a seção Propriedades dos detalhes do erro:
Você pode clicar nos botões Voltar e Próxima abaixo do gráfico "Gannt" para alternar entre as etapas no fluxo e ver os detalhes de cada uma.
Para fazer o download de toda a sessão de depuração como um único documento, clique em
Fazer o download da sessão.
Uma sessão de depuração é excluída em até 24 horas após a conclusão. Portanto, se você quiser visualizá-la depois desse período, precisará fazer o download dela antes disso.
Editor de Proxy clássico
Na guia Desenvolver do proxy da API, edite o <Rate> da política do Speike Arrest
para 1pm e depois clique em
Salvar o proxy. Com isso, você poderá ver chamadas de API bem-sucedidas e com falha (acima
do limite).
No editor de proxy, clique na guia Depuração.
Em Iniciar uma sessão de depuração, selecione o ambiente em que seu proxy
está implantado.
Clique em Iniciar sessão do Debug.
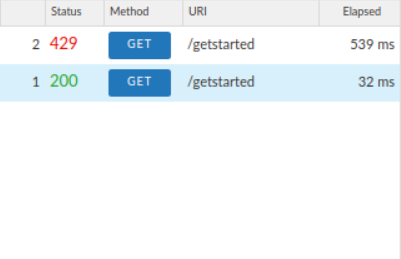
Chame o proxy de API novamente usando curl (ou a URL em um navegador da Web) até ver
pelo menos uma resposta 200 e uma 429 no painel Transações de depuração.
Clique na transação 200 no painel Transações à esquerda. Os detalhes
da depuração são carregados na janela principal do Mapa de transações, que mostra um diagrama de
solicitação/resposta. O ícone do Spike Arrest está no fluxo de solicitação.
No diagrama de fluxo, clique no ícone de círculo na resposta, o
mais à direita (mostrado no diagrama a seguir).
O painel Detalhes da fase mostra os dados disponíveis nesse ponto do
fluxo. Ao rolar o painel, você verá os cabeçalhos de resposta HTTP e o conteúdo
do corpo.
Agora veja um erro na depuração.
Clique na transação 429 no painel "Transações". Na janela principal
do editor, você vê um diagrama de fluxo com itens somente na solicitação, incluindo um ícone de detenção
de pico com um ponto de exclamação vermelho indicando um erro.
Clique no pequeno tubo ícone de erro à direita do ícone "Detenção de pico" e
observe os detalhes da violação de detenção de pico no painel Detalhes da fase.
Clique nos botões Voltar e Avançar no diagrama
de fluxo para se mover entre os pontos no fluxo e ver os detalhes da depuração.
Se você quiser ver toda a sessão de depuração como um único documento, faça o download clicando em
Fazer o download da sessão de depuração.
[[["Fácil de entender","easyToUnderstand","thumb-up"],["Meu problema foi resolvido","solvedMyProblem","thumb-up"],["Outro","otherUp","thumb-up"]],[["Difícil de entender","hardToUnderstand","thumb-down"],["Informações incorretas ou exemplo de código","incorrectInformationOrSampleCode","thumb-down"],["Não contém as informações/amostras de que eu preciso","missingTheInformationSamplesINeed","thumb-down"],["Problema na tradução","translationIssue","thumb-down"],["Outro","otherDown","thumb-down"]],["Última atualização 2025-09-04 UTC."],[[["\u003cp\u003eThis tutorial teaches you how to use the Apigee Debug view to examine API proxy request and response flows, including headers, variables, objects, and response time.\u003c/p\u003e\n"],["\u003cp\u003eYou will learn to identify error messages, specifically when the SpikeArrest policy rate is exceeded, by observing the HTTP 429 status code in transactions within the Debug view.\u003c/p\u003e\n"],["\u003cp\u003eThe guide includes steps for configuring the SpikeArrest policy's rate to 1pm, enabling you to observe both successful (200) and rate-exceeded (429) responses in the debug session.\u003c/p\u003e\n"],["\u003cp\u003eDebug sessions can be downloaded as single documents for later review, but note that sessions are automatically deleted after 24 hours.\u003c/p\u003e\n"],["\u003cp\u003eThe Debug Tool is available in the Google Cloud console, Classic UI, with different versions and some actions can be performed using the API.\u003c/p\u003e\n"]]],[],null,["# View message data with the Debug view\n\n*This page\napplies to **Apigee** and **Apigee hybrid**.*\n\n\n*View [Apigee Edge](https://docs.apigee.com/api-platform/get-started/what-apigee-edge) documentation.*\n\n**What you'll learn**\n\nIn this tutorial, you'll learn to:\n\n- See the response message's headers and body content.\n- See error messages.\n\n**What you'll need**\n\nBefore you begin this tutorial, do the following:\n\n- Ensure that [`curl`](https://curl.haxx.se/) is installed on your machine to make API calls from the command line.\n- Complete the steps in [Before you begin](/apigee/docs/api-platform/get-started/overview).\n- Add a [SpikeArrest policy to your proxy](/apigee/docs/api-platform/tutorials/add-spike-arrest). The SpikeArrest policy is a policy that restricts the number of requests that can be sent to your API proxy. Your proxy must have at least one [policy](/apigee/docs/api-platform/get-started/add-policy).\n\nView message data\n-----------------\n\n\nThe Debug view in the Apigee Proxy Editor lets you view headers, variables,\nobjects, and other details such as response time in the API proxy request\nand response flow. The Debug view also lets you see how a request or\nresponse changes as it is processed by an API proxy. For a more detailed\ndescription of the debug view, see\n[Using Debug](/apigee/docs/api-platform/debug/trace).\n\n\nThis page describes how to use the Debug view to see what happens when the\nSpikeArrest policy rate is exceeded.\n**Note:** The Debug Tool is available in the Google Cloud console, the Classic UI, and some debug actions can be performed using the API as described in the following tabs. The Google Cloud console options are Debug v2 (new) and Debug v1 (released [07/01/2022](/apigee/docs/api-platform/release-notes#July_01_2022)). You can switch between versions of the Debug Tool in the Google Cloud console and the Classic UI. \n\n### Cloud Console UI\n\n### Debug v2 (new)\n\n\nTo use the Debug view in the Cloud Console UI to see what happens\nwhen the SpikeArrest policy rate is exceeded:\n\n1. Open the [Cloud Console UI](https://console.cloud.google.com/apigee).\n2. Select your project.\n3. Click **Proxy development \\\u003e API Proxies**.\n4. Click the name of the API proxy you want to debug.\n5. Click the **Develop** tab.\n6. Click the **Policies \\\u003e SpikeArrest** policy.\n7. In the edit pane, change **Rate** to **1pm**.\n8. Click **Save**.This will allow you to see both successful and failed (over the limit) API calls.\n9. [Deploy](/apigee/docs/api-platform/deploy/ui-deploy-new) the updated proxy.\n10. Click the **Debug** tab.\n11. Click **Start Debug Session** .\n\n In the dialog:\n 1. Select the **Environment** in which you want to run the debug session.\n 2.\n (Optional) From the **Filter** drop-down list, select a\n filter to apply to all transactions in the debug session you\n are creating. The default is `None (All\n transactions)`, which includes all transactions in the\n debug data.\n\n\n For information on using filters, see\n [Using filters in a debug session](/apigee/docs/api-platform/debug/trace#debugsession-filter).\n For information about the built-in filters, see\n [Using predefined filters](/apigee/docs/api-platform/debug/trace#predefined-filters).\n 3. Click **Start**.\n12.\n [Call the API](/apigee/docs/api-platform/get-started/test-proxy) proxy using `curl` (or with the URL in a web\n browser) several times until you see at least one `200`\n response and one `429` response in the\n **Transactions** pane.\n\n | **Note:** The HTTP status code for exceeding the rate limit is `429 Too many requests`.\n13.\n Click a `429` transaction. In the **Transaction map**\n pane, this displays a flow diagram including a SpikeArrest policy\n with an error icon.\n\n14.\n Click the error\n **error** icon. The **Error Properties** pane is displayed.\n\n\nYou can click the\nnavigate_before\n**Previous** and\nnavigate_next\n**Next** buttons to move between steps in the flow and see the\ndetails of each step.\n\n\nTo download the entire debug session as a single document, click\n**Download Session**. A debug session is deleted within 24 hours\nof the time it is completed, so if you want to view the session after\nthat time, you need to download it before then.\n\n### Debug v1\n\n1. On the **Develop** tab of the API Proxy, edit the Spike Arrest policy's **\u003cRate\u003e** to be **1pm** again, then **Save** the proxy. This will allow you to see both successful and failed (over the limit) API calls.\n2. In the Proxy Editor, click the **Debug** tab.\n3. Click **Start Debug Session**.\n4. In the dialog:\n 1. Select the **Environment** in which you want to run the debug session.\n 2. (Optional) From the **Filter** drop-down list, select a filter to apply to all transactions in the debug session you are creating. The default is `None (All transactions)`, which includes all transactions in the debug data.\n\n For information on using filters, see [Using filters in a debug session](#debugsession-filter).\n For information about the built-in filters, see [Using predefined filters](#predefined-filters).\n 3. Click **Start**.\n5. [Call the API](/apigee/docs/api-platform/get-started/test-proxy)\n proxy again using `curl` (or with the URL in a web browser) several times\n until you see\n at least one `200` response and one `429` response in the left-hand pane.\n\n | **Note:** The HTTP status code for exceeding the rate limit is `429 Too many requests`.\n6. Click the `429` transaction in the left-hand pane. This displays a [Gantt chart](https://en.wikipedia.org/wiki/Gantt_chart) for the transaction in the right-hand pane.\n\n Note that there is a row for the Spike Arrest policy, which is displayed with an error icon.\n7. Click the row labeled **Error** . This displays the error details to the\n right of the chart. The picture below shows the **Properties** section of the error details:\n\nYou can click the **Back** and **Next** buttons below the Gannt\nchart to move between steps in the flow and see the details of each step.\n\nTo download the entire debug session as a single document, click\n**Download Session**.\nA debug session is deleted within 24 hours of the time it is completed, so if\nyou want to view the session after that time, you need to download it before then.\n\n### Classic UI\n\n1. On the **Develop** tab of the API proxy, edit the Spike Arrest policy's **\u003cRate\u003e** to be **1pm** again, then **Save** the proxy. This will allow you to see both successful and failed (over the limit) API calls.\n2. In the Proxy Editor, click the **Debug** tab.\n3. Under **Start a debug session**, select the environment to which your proxy is deployed.\n4. Click **Start Debug Session**.\n5. Call the API proxy again using `curl` (or with the URL in a web browser) until you see\n at least one `200` response and one `429` response in the **Debug Transactions** pane.\n\n ```\n curl -v https://YOUR_ENV_GROUP_HOSTNAME/my-proxy\n ```\n\n where \u003cvar translate=\"no\"\u003eYOUR ENV_GROUP_HOSTNAME\u003c/var\u003e is the environment group hostname. See\n [Find the environment group hostname](/apigee/docs/api-platform/get-started/test-proxy#find-the-environment-group-hostname).\n\n A `200` response and a `429` response are shown below.\n\n | **Note:** The default HTTP status code for exceeding the rate limit is `429 Too many requests`.\n |\n | If you want the status code to be different (`500`, for example) for all Spike Arrest policies used in an\n | organization, a property needs to be set on your organization. If you're a Cloud customer,\n | contact [Google Cloud Customer Care](https://cloud.google.com/support-hub/) to set that property.\n6. Click the `200` transaction in the left **Transactions** pane. Its Debug detail is loaded in the main window under **Transaction Map**, which shows a request/response diagram. The Spike Arrest icon is in the request flow.\n7. In the flow diagram, click the **circle icon** in the response, the furthest one to the right (shown in the following diagram).\n\n The **Phase Details** pane shows the data available at that point in the\n flow. If you scroll through that pane, you'll see the HTTP response headers and body\n content.\n8. Now look at an error in Debug. Click the `429` transaction in the Transactions pane. In the main editor\n window, you see a flow diagram with items in the request only, including a Spike Arrest\n icon with a red exclamation point indicating an error.\n\n Click the small tube-shaped **error icon** to the right of the Spike Arrest icon, and\n look at the spike arrest violation details in the **Phase Details** pane.\n\nYou can click the **Back** and **Next** buttons in the flow\ndiagram to move between points in the flow and see the Debug details.\n\nIf you want to see the entire Debug session as a single document, download it by clicking\n**Download Debug Session**.\n\nFor more information, see [Using Debug](/apigee/docs/api-platform/debug/trace)."]]