本頁內容適用於 Apigee 和 Apigee Hybrid。
查看
Apigee Edge 說明文件。

這個資訊主頁會顯示哪些資訊?
「流量組成」資訊主頁會評估主要 API、應用程式、開發人員和產品對整體 API 計畫的相對貢獻。
您可以使用這份報表偵測業務問題,例如流量趨勢下滑,或是主要應用程式和開發人員的貢獻度降低。您可以根據這項資料,決定要採取哪些修正措施。您也可以提早收到通知,瞭解哪些新實體會增加 API 流量,並採取行動因應,例如判斷哪些新開發人員的貢獻度高,並將他們納入培育計畫。
「流量構成」資訊主頁
如要存取「流量構成」資訊主頁,請按照下列步驟操作:
在 Google Cloud 控制台中,依序前往「Analytics」(分析) >「Developer analysis」(開發人員分析) >「Traffic composition」(流量組成) 頁面。
系統會開啟資訊主頁,如下所示:
使用資訊主頁
資訊主頁提供一組下拉式選單,可用來篩選主頁顯示的資訊。篩選器下拉式選單是動態的。 舉例來說,如果您從「開發人員」下拉式選單中選取開發人員,系統就會在其他下拉式選單、圖表和表格中,自動選取與該開發人員相關聯的所有 Proxy、應用程式和 API 產品。詳情請參閱 Looker Studio 說明文件中的「篩選器屬性簡介」。
使用日期選取器挑選要評估的開始和結束日期。日期選取器只能以天為單位選取日期。時間範圍增量不得小於一天。
這個資訊主頁會評估哪些資料?
這個資訊主頁有兩種評估模式,可透過「總覽」和「維度」分頁標籤選取:
| 模式 | 說明 |
|---|---|
| 總覽 | 可快速查看 Proxy、開發人員應用程式、產品和開發人員的流量模式。舉例來說,您可以透過這個檢視畫面,瞭解哪個 Proxy、應用程式、產品或開發人員帶來的流量最多。 |
| 維度 | 您可以深入查看 Proxy、開發人員應用程式、產品和開發人員流量的詳細資料。 |
總覽模式提供的資訊
按一下「總覽」即可顯示這個模式。這個模式會顯示一組簡單的圖表,說明 Proxy、開發人員應用程式、開發人員和產品的流量模式。
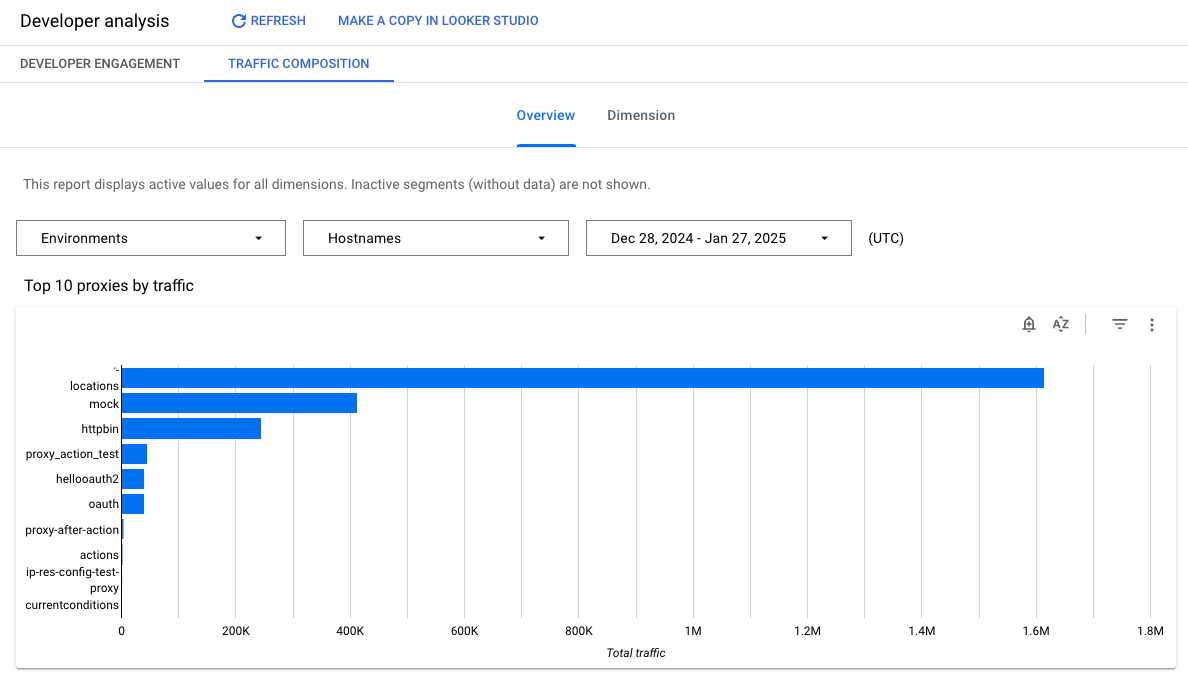
下圖顯示流量組成總覽頁面的一部分:
| 模式 | 說明 |
|---|---|
| 依流量排序的前 10 個 Proxy | 顯示 API 流量最多的前 10 個 Proxy。 |
| 流量最多的前 10 大開發人員 | 顯示 API 流量最高的前 10 位開發人員。 |
| 流量最高的 10 項產品 | 顯示 API 流量最高的前 10 項產品。 |
| 流量最多的前 10 個應用程式 | 顯示 API 流量最多的前 10 個開發人員應用程式。 |
維度模式的意義
按一下「維度」即可顯示這個模式。這個模式可讓您深入瞭解特定 Proxy、開發人員應用程式、開發人員和產品的流量模式詳細資料。
維度模式顯示的詳細資料包括:
| 指標 | 說明 |
|---|---|
| 依 Proxy 劃分的流量變化趨勢 | 可查看每個 Proxy 的相對流量貢獻。 |
| 開發人員的流量變化趨勢 | 可查看每位開發人員的相對流量貢獻。 |
| 各項產品的流量變化趨勢 | 可查看各項 API 產品的相對流量貢獻。 |
| 依應用程式區分的流量變化趨勢 | 可查看各個開發人員應用程式的相對流量貢獻。 |
在 Looker Studio 中建立副本
您可以在 Looker Studio 中編輯、儲存及共用資訊主頁副本。如要開始使用,請按照下列步驟操作:
- 按一下「在 Looker Studio 中建立副本」。
- 在下拉式選單中選取要複製的報表。
- 在 Looker Studio 中,按一下「儲存並共用」。
- 按一下「確認並儲存」。
您現在可以編輯儲存在使用者帳戶中的副本。如要瞭解如何使用 Looker Studio 編輯及建立報表,請參閱 Looker Studio 說明文件。