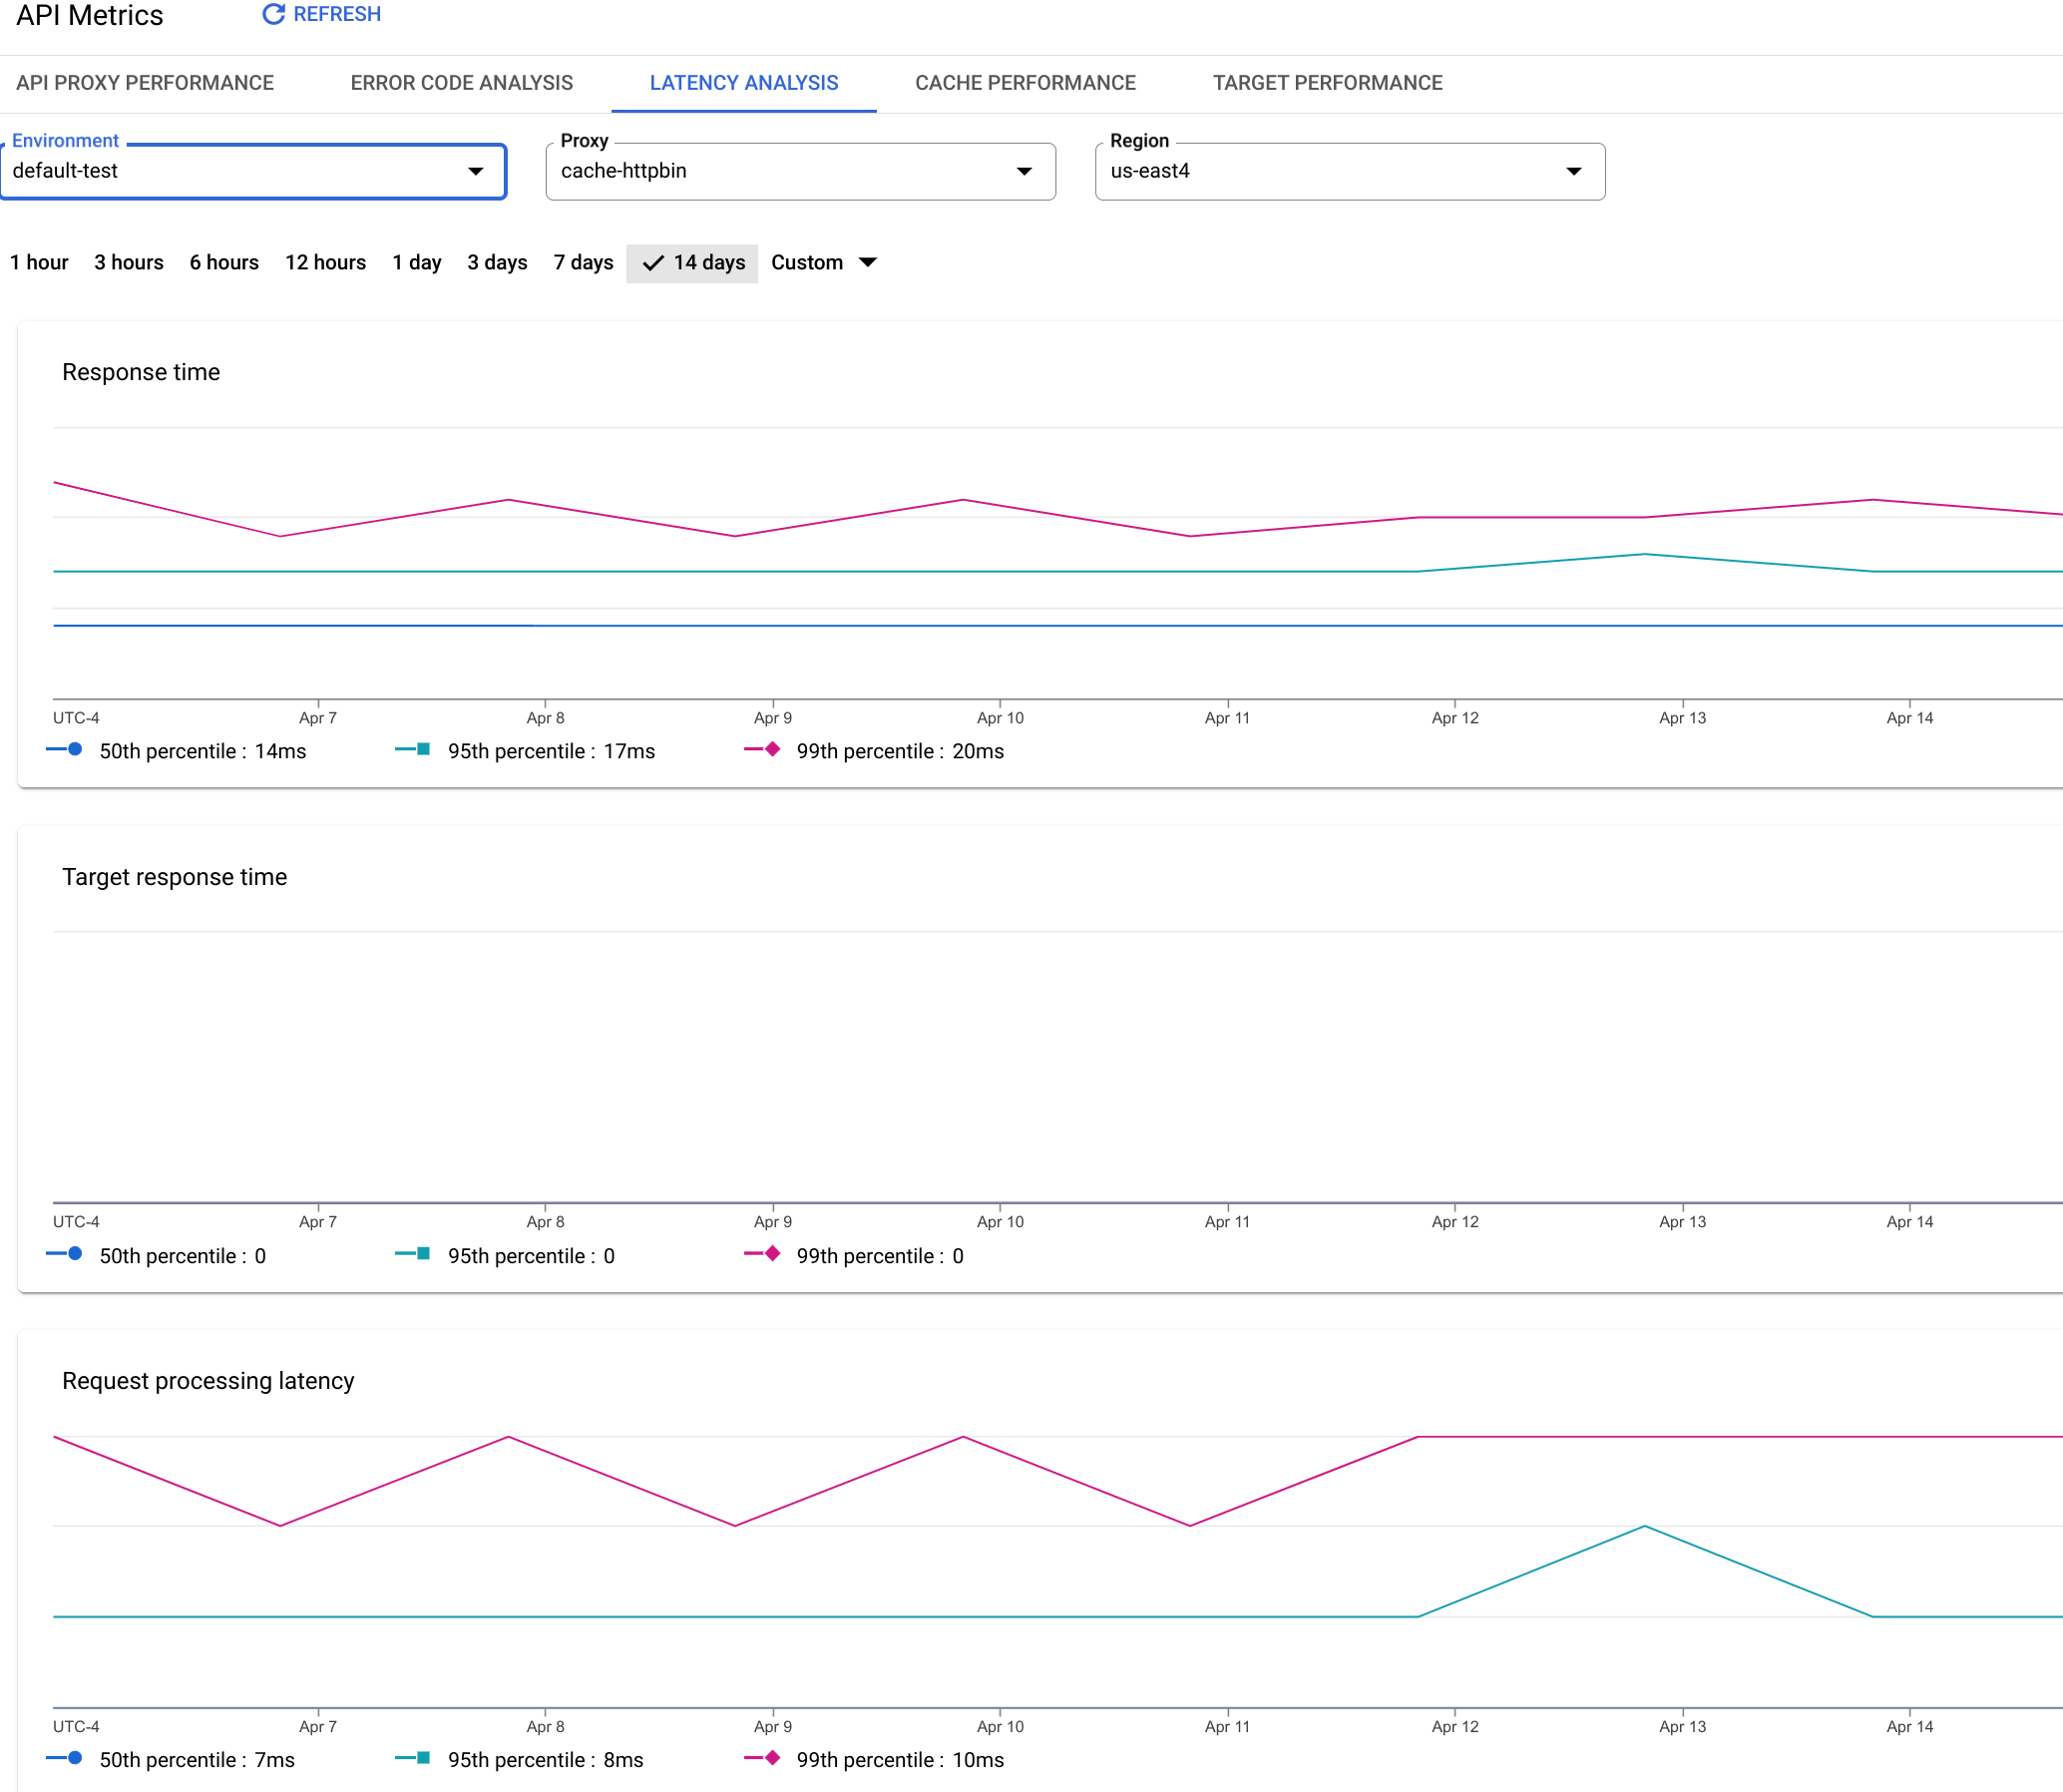
지연 시간 분석 대시보드는 API 프록시에서 발생할 수 있는 지연 시간 문제를 알려줍니다. 중앙값, 95번째, 99번째 백분위수 값을 강조하여 대기 시간 측정 값을 1분 단위로 표시합니다.
중앙값은 이 값보다 적은 지연 시간이 발생하는 트래픽의 절반과 이 값보다 큰 지연 시간이 발생하는 트래픽의 절반 지점을 나타냅니다. 예를 들어 선택한 API 프록시의 응답 지연 시간 중앙값이 62ms인 경우 이 API 프록시의 응답 중 절반은 62ms 미만이 소요됩니다. 또한 이 API 프록시의 응답 중 절반은 62ms를 초과하여 소요됩니다.
95번째 백분위수 및 99번째 백분위수 값은 이 값보다 적은 95% 및 99%의 트래픽에서 지연 시간이 발생하는 지점을 알려줍니다. 더 중요한 것은 트래픽의 5%와 1%에서 범위를 벗어난 지연 시간 값이 발생하고 있다는 것을 알려주며 범위 외의 행동을 지적할 수 있다는 것입니다.
지연 시간 분석 대시보드
지연 시간 분석 대시보드에 액세스하려면 다음 단계를 따르세요.
Google Cloud 콘솔에서 분석 > API 측정항목 > 지연 시간 분석 페이지로 이동합니다.
[[["이해하기 쉬움","easyToUnderstand","thumb-up"],["문제가 해결됨","solvedMyProblem","thumb-up"],["기타","otherUp","thumb-up"]],[["이해하기 어려움","hardToUnderstand","thumb-down"],["잘못된 정보 또는 샘플 코드","incorrectInformationOrSampleCode","thumb-down"],["필요한 정보/샘플이 없음","missingTheInformationSamplesINeed","thumb-down"],["번역 문제","translationIssue","thumb-down"],["기타","otherDown","thumb-down"]],["최종 업데이트: 2025-08-18(UTC)"],[[["\u003cp\u003eThis Latency Analysis dashboard applies to both Apigee and Apigee hybrid platforms, providing insights into API proxy performance.\u003c/p\u003e\n"],["\u003cp\u003eThe dashboard measures and displays latency in milliseconds, broken down into median, 95th percentile, and 99th percentile values to identify potential issues.\u003c/p\u003e\n"],["\u003cp\u003eThe dashboard includes key latency metrics such as Response Time, Target Response Time, Request Processing Latency, and Response Processing Latency, to provide details of how each component of the API proxy is performing.\u003c/p\u003e\n"],["\u003cp\u003eAccess the Latency Analysis dashboard via the Analytics > API metrics section in the Apigee UI in Cloud console, or via Analyze > API Metrics > Latency Analysis in the classic Apigee UI.\u003c/p\u003e\n"],["\u003cp\u003eNote that after API calls are made, there can be a 10 minute delay for the data to appear in the dashboard.\u003c/p\u003e\n"]]],[],null,["# Latency analysis dashboard\n\n*This page\napplies to **Apigee** and **Apigee hybrid**.*\n\n\n*View [Apigee Edge](https://docs.apigee.com/api-platform/get-started/what-apigee-edge) documentation.*\n\n\n| **Note:** This feature may not be available in all Apigee plans. To see which pricing plan includes this feature, see \u003chttps://cloud.google.com/apigee/pricing/\u003e.\n\n\u003cbr /\u003e\n\nWhat does this dashboard tell me?\n---------------------------------\n\nThe Latency Analysis dashboard can alert you to any latency issues your API proxies may be\nexperiencing. It displays latency measurements down to the window of a minute, highlighting the\nmedian, 95th percentile, and 99th percentile values.\n\nThe median value tells you the point at which half of your traffic is experiencing latency\nthat is less than this value and half of your traffic is experiencing latency that is greater\nthan this value. For example, if the median response time latency for your selected API proxy is\n62 ms, it means that half of the responses from this API proxy take less than 62 ms. It also\nmeans that half of the responses from this API proxy take more than 62 ms.\n\nThe 95th percentile and 99th percentile values tell you the point at which 95% and 99% of your\ntraffic is experiencing latency that is less than these values. Or rather more importantly, it\ncan point out outlying behavior, telling you that 5% and 1% of your traffic is experiencing\nlatency values that are out-of-range.\n\n\n| **Note:** **Data delay interval** \n| After API calls are made to proxies, it may take up to **10 minutes** for the data to appear in dashboards, custom reports, and management API calls.\n\n\u003cbr /\u003e\n\nThe Latency Analysis dashboard\n------------------------------\n\nTo access the Latency Analysis dashboard:\n\nIn the Google Cloud console, go to the **Analytics \\\u003e API metrics \\\u003e Latency Analysis** page.\n\n[Go to Latency Analysis](https://console.cloud.google.com/apigee/analytics/latency)\n\nThe **Latency Analysis** view is shown:\n\nWhat does this dashboard\nmeasure?\n---------------------------------\n\nSee also this interesting article on the Apigee Community site:\n[When can the Average Total Response Time be less than the Average Target Response Time?](https://community.apigee.com/articles/2695/when-can-the-average-total-response-time-be-less-t.html)"]]