本页面适用于 Apigee 和 Apigee Hybrid。
查看 Apigee Edge 文档。

此信息中心可以提供什么信息?
Geomap 信息中心会跟踪各个地理位置的流量模式、错误模式和服务质量。您可以查看有关所有 API 的信息,也可以放大特定 API 来查看信息。此信息中心可帮助您评估:
- API 增长趋势 - 使用流量总和指标了解流量的来源。通过使用不同的时间段,您可以了解哪些国家/地区在哪些时间生成最多流量。您还可以记录不同时间段的流量速率以查看增长趋势。
- 错误趋势 - 使用错误总数指标了解 API 错误的来源。通过使用不同的时间段,您可以了解哪些国家/地区在哪些时间生成最多错误。您还可以记录不同时间段的错误率以查看增长趋势。
- 服务质量 - 使用总响应时间平均值和目标响应时间平均值指标了解您的后端服务在不同国家/地区的履行情况。
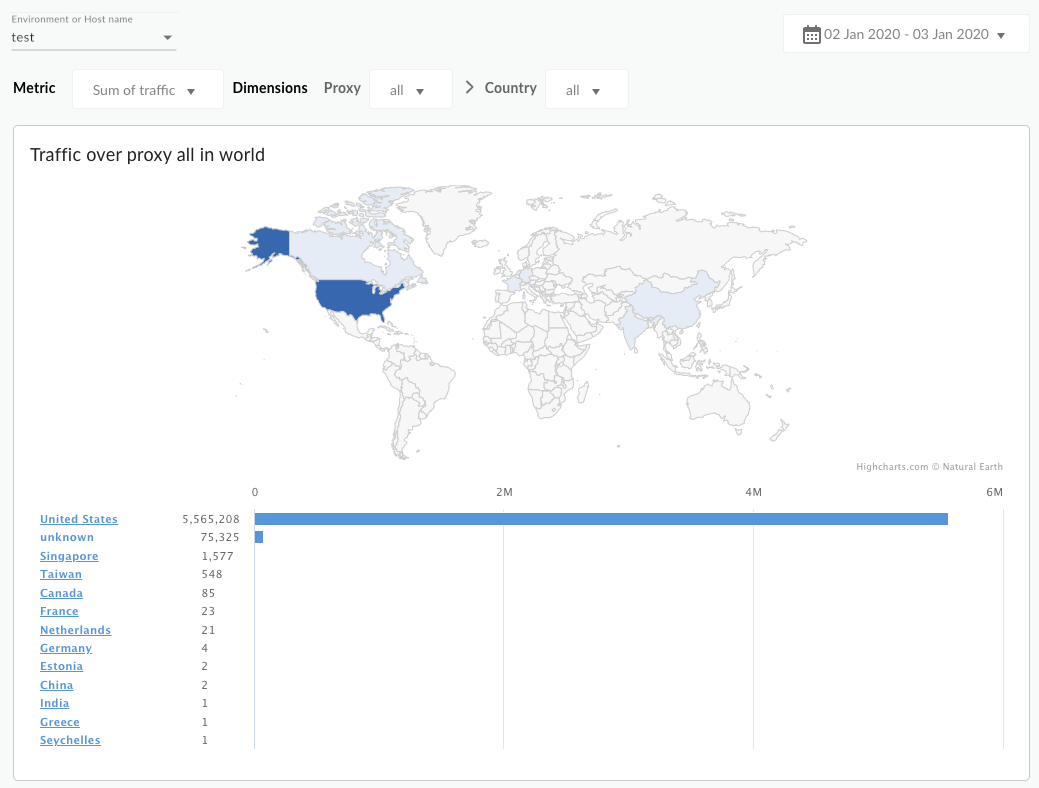
Geomap 信息中心
要访问 Geomap 信息中心,请执行以下操作:
在 Google Cloud 控制台中,依次前往 Analytics > 最终用户分析 > Geomap 页面。
该信息中心将打开,如下所示:
此信息中心衡量的是什么?
默认情况下,信息中心会显示流量总和指标。下表介绍了 Geomap 信息中心跟踪的各项指标:
| 指标 | 说明 |
|---|---|
| 总流量 | 也称为吞吐量。组织看到的 API 请求数和生成的响应数。 |
| 错误总数 | 失败的所有 API 请求总数,即请求没有按最终用户预期进行响应。 |
| 总响应时间平均值 | API 响应传入请求所用的时间。 |
| 目标响应时间的平均值 | 目标端点响应所选时间段的传入请求所用的平均时间。 |
使用信息中心
信息中心包含一组下拉菜单,您可以使用这些下拉菜单过滤其中显示的信息。过滤条件下拉菜单是动态的。例如,如果您从“环境”下拉菜单中选择某个环境,则与该环境关联的任何代理、主机名、国家/地区和区域都会在其他下拉菜单、图表和表格中自动选中。如需了解详情,请参阅 Looker Studio 文档中的过滤条件属性简介。
使用日期选择器选择要衡量的开始日期和结束日期。日期选择器仅允许您以天为增量选择日期。您无法选择小于一天的时间范围增量。
该地图是互动式的。点击某个国家/地区即可查看该国家/地区的流量。您可以右键点击数据表,以执行排序和导出数据等操作。
关于此信息中心,还需要了解哪些信息?
默认情况下,信息中心会显示所有 API 代理的指标。或者,从代理下拉菜单中选择要衡量的 API 代理。
在国家/地区和地理区域列表下选择一个条目,以在特定国家/地区、省/州和城市(具体取决于您感兴趣的国家/地区的具体地理位置)上展开细目。 例如,您可以先查看美国数据,然后选择某个地理区域,再查看生成流量的城市列表。您可以点击表格中的城市名称,查看该城市的流量。
此信息中心使用标准控件,例如日期选择器、将鼠标悬停在地图上可查看更多上下文、将数据导出为 CSV 等。如需了解详情,请参阅使用分析信息中心。
在 Looker Studio 中制作副本
您可以在 Looker Studio 中修改、保存和共享信息中心副本。要开始使用,请执行以下操作:
- 点击在 Looker Studio 中制作副本。
- 从下拉菜单中选择要复制的报告。
- 在 Looker Studio 中,点击保存并共享。
- 点击确认并保存。
现在,您可以修改以您的用户账号保存的副本。如需详细了解如何使用 Looker Studio 修改和创建报告,请参阅 Looker Studio 文档。