오류 코드 분석 대시보드는 API 프록시 및 대상의 오류율을 알려줍니다.
오류 코드 분석 대시보드는 다음을 사용합니다.
프록시 오류를 계산하는 응답 코드
대상 오류를 계산하기 위한 대상 응답 코드
오류 코드 분석 대시보드는 is_error 흐름 변수를 기반으로 오류율을 계산하기 때문에 이 대시보드에 보고된 오류는 API 프록시 성능 대시보드에 보고된 오류와 다를 수 있습니다. 이 변수는 API 프록시에서 명시적으로 설정할 수 있으므로 프록시 응답 또는 대상 응답의 오류 코드와 관련이 없습니다.
오류율을 계산할 때:
프록시는 대상 오류를 처리하고 여전히 성공 응답을 반환할 수 있습니다. 이 경우 오류는 대상 오류로 계산되지만 프록시 오류로 간주되지 않습니다.
대상 응답이 성공하거나 존재하지 않지만 프록시가 오류와 함께 응답되면 프록시에 대해 오류가 계산됩니다.
프록시와 대상 모두 오류와 함께 응답하는 경우 대상에서 오류가 계산됩니다.
오류 코드 분석 대시보드
오류 코드 분석 대시보드에 액세스하려면 다음 안내를 따르세요.
Google Cloud 콘솔에서 애널리틱스 > API 측정항목 > 오류 코드 분석 페이지로 이동합니다.
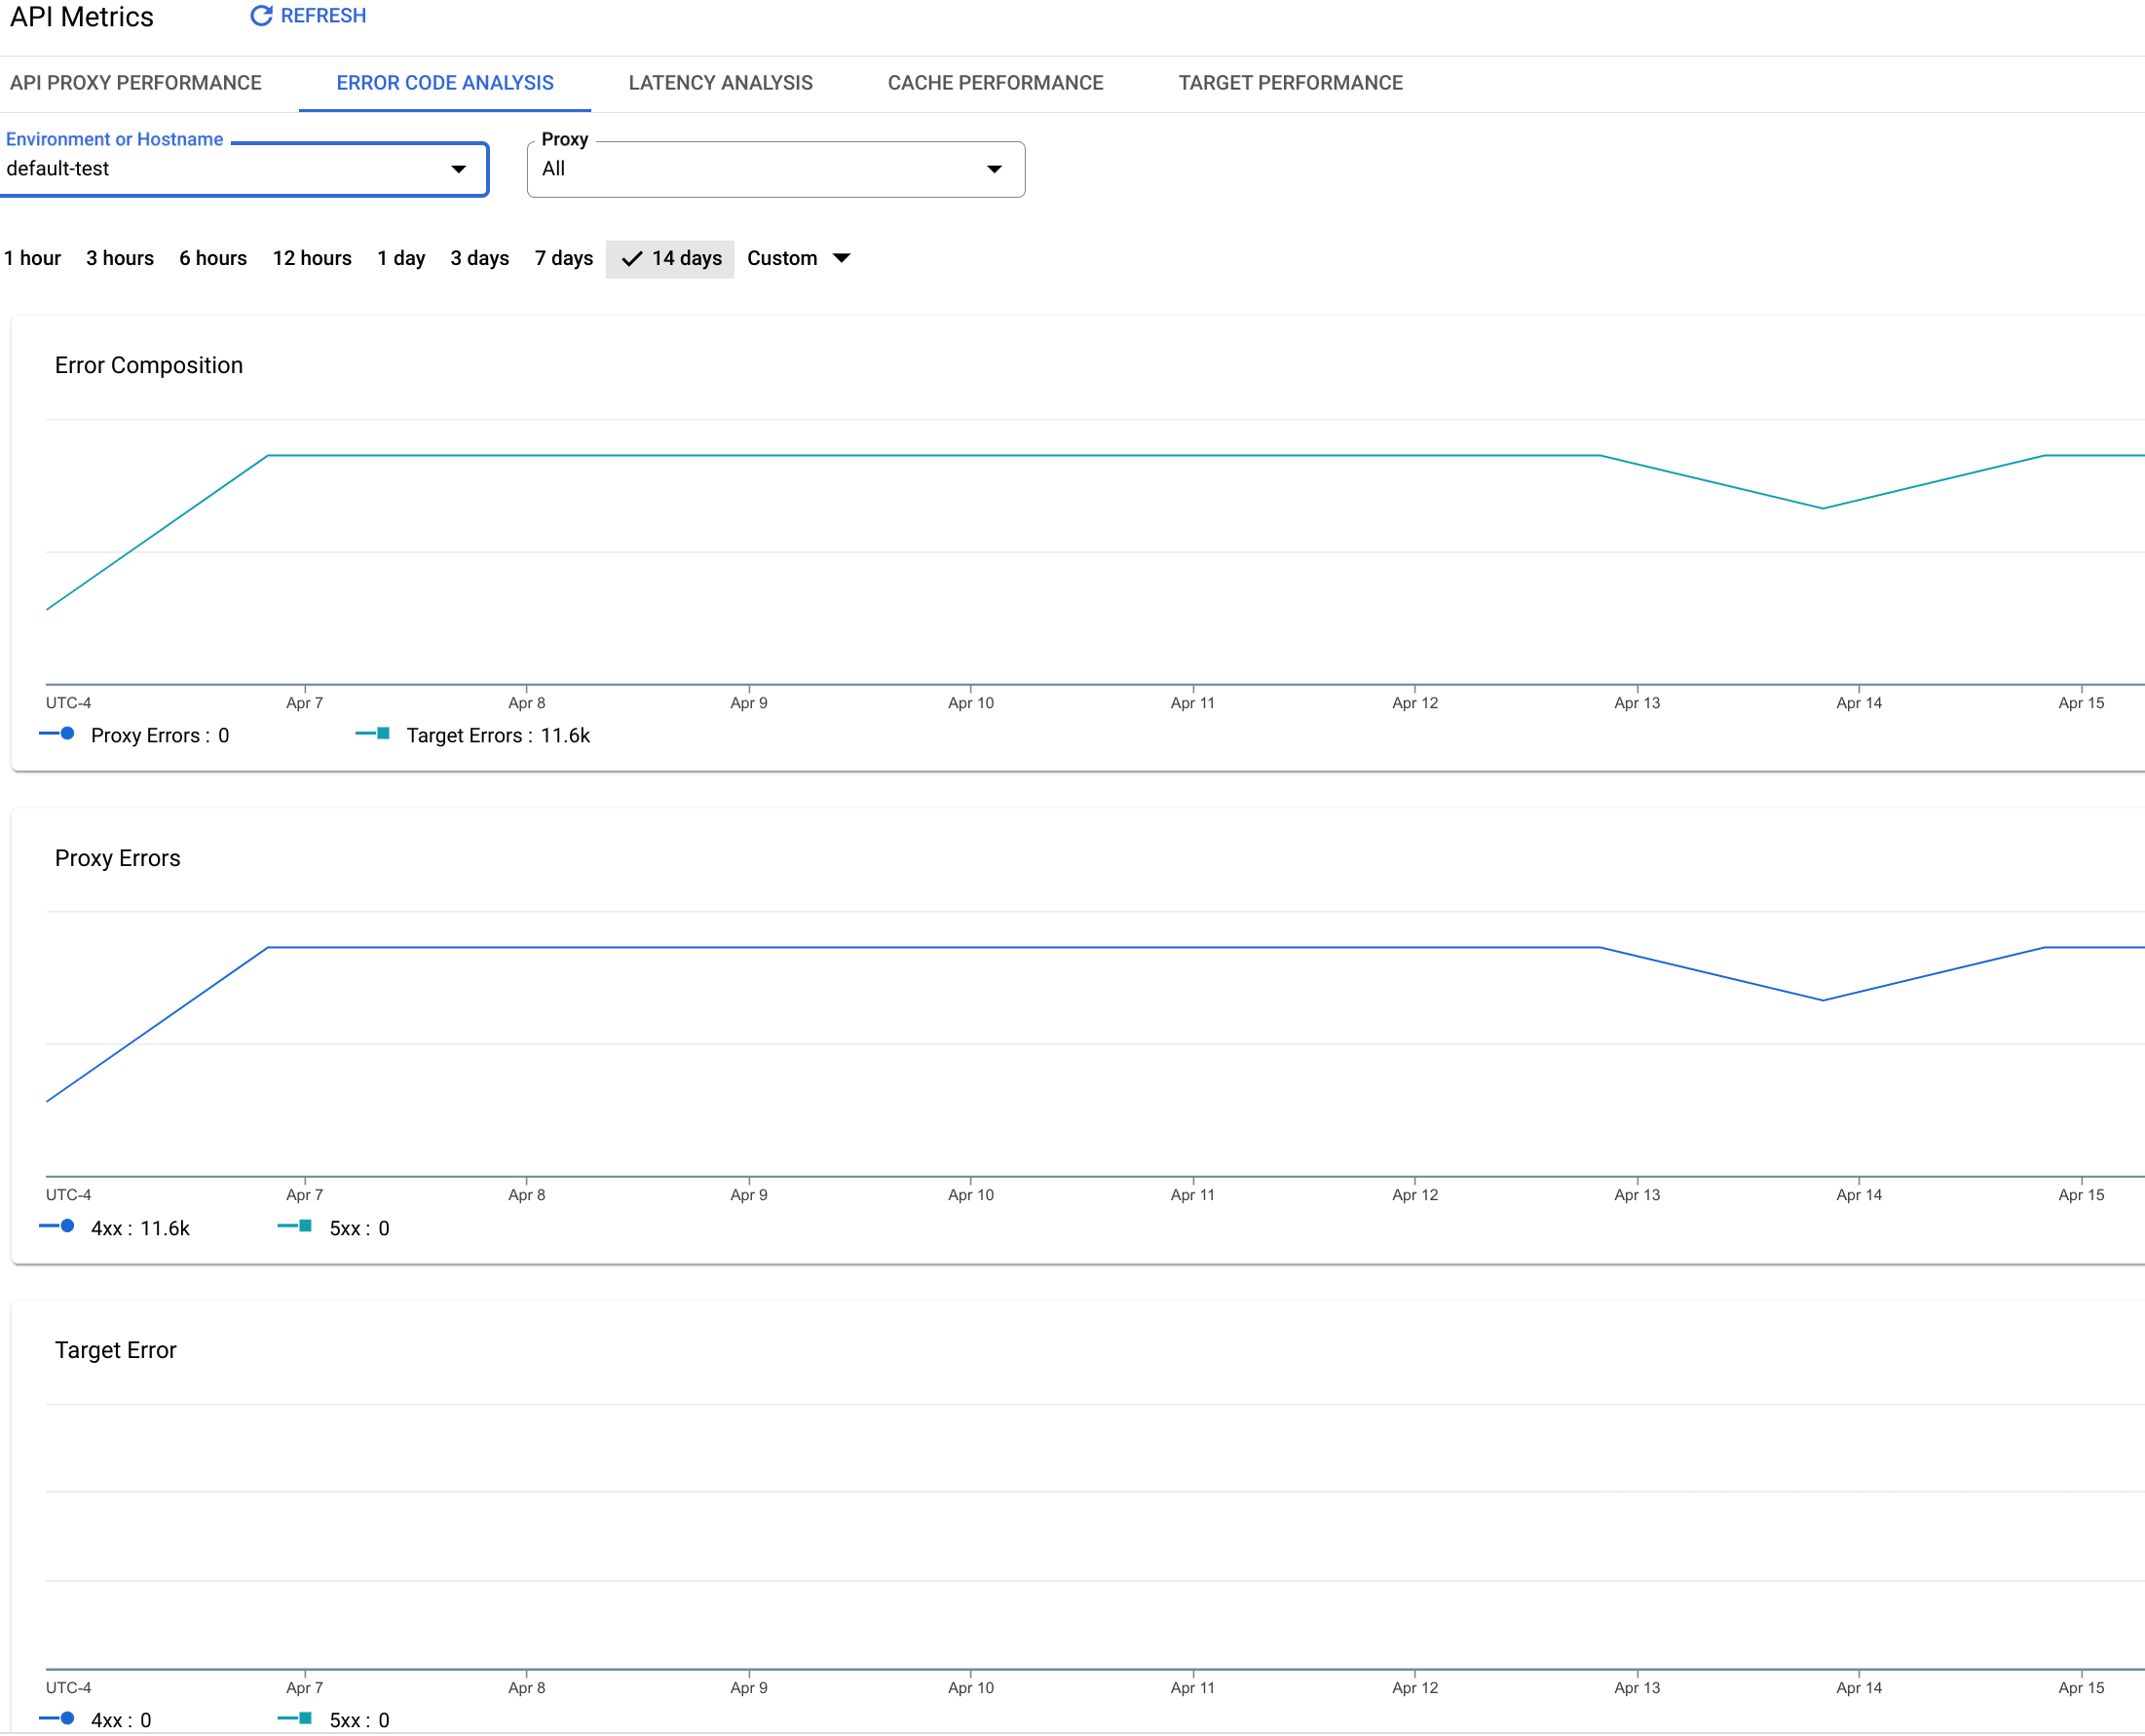
응답 코드에서 결정한 지정된 기간 동안 Apigee 조직에 표시되는 총 프록시 오류 수입니다.
프록시 오류는 Apigee가 클라이언트의 전체 요청을 수신한 시간과 요청을 백엔드 대상으로 전송한 시간 사이에 측정됩니다.
대상 오류
대상 응답 코드에서 결정한 지정된 기간 동안 Apigee 조직에 표시되는 총 대상 오류 수입니다.
대상 오류는 Apigee가 전체 요청을 백엔드 대상으로 보낸 시간과 응답을 클라이언트 앱으로 반환한 시간 사이에 측정됩니다.
프록시 오류
측정항목
설명
총 프록시 오류 수
지정된 기간에 Apigee 조직에 표시된 총 프록시 오류 수입니다. 프록시 오류는 Apigee가 클라이언트의 전체 요청을 수신한 시간과 요청을 백엔드 대상으로 전송한 시간 사이에 측정됩니다.
4XX
HTTP 4xx 오류를 발생시킨 프록시 오류 수를 표시합니다. HTTP 상태 코드의 전체 목록은 HTTP 사양의 '상태 코드 정의'를 참조하세요.
5XX
HTTP 5xx 오류를 발생시킨 API 요청 수를 표시합니다. HTTP 상태 코드의 전체 목록은 HTTP 사양의 '상태 코드 정의'를 참조하세요.
대상 오류
측정항목
설명
총 대상 오류 수
지정된 기간에 Apigee 조직에 표시된 총 대상 오류 수입니다. 대상 오류는 Apigee가 전체 요청을 백엔드 대상으로 보낸 시간과 응답을 클라이언트 앱으로 반환한 시간 사이에 측정됩니다.
4XX
HTTP 4xx 오류를 발생시킨 대상 오류 수입니다. HTTP 상태 코드의 전체 목록은 HTTP 사양의 '상태 코드 정의'를 참조하세요.
5XX
HTTP 5xx 오류가 발생한 대상 오류 수입니다. HTTP 상태 코드의 전체 목록은 HTTP 사양의 '상태 코드 정의'를 참조하세요.
프록시별 오류
측정항목
설명
<프록시 이름>
지정된 기간에 각 개별 프록시에 대해 Apigee 조직에 표시된 총 프록시 오류 수입니다. 막대 위로 마우스를 가져가면 각 프록시 요청 흐름과 대상 요청 흐름에서 각기 발생한 오류 수를 확인할 수 있습니다.
프록시 오류는 Apigee가 클라이언트의 전체 요청을 수신한 시간과 요청을 백엔드 대상으로 전송한 시간 사이에 측정됩니다.
타겟별 오류
측정항목
설명
<대상 이름>
지정된 기간에 각 개별 대상에 대해 Apigee 조직에 표시된 총 대상 오류 수입니다. 대상에 도달하지 못한 호출 수는 연결되지 않은 대상 열에 나열됩니다. 막대 위로 마우스를 가져가면 각 프록시 응답 흐름과 대상 응답 흐름에서 각기 발생한 오류 수를 확인할 수 있습니다.
대상 오류는 Apigee가 전체 요청을 백엔드 대상으로 보낸 시간과 응답을 클라이언트 앱으로 반환한 시간 사이에 측정됩니다. 이 차트에는 프록시 응답 흐름에서 발생한 오류 수와 대상 응답 흐름에서 발생한 오류 수가 각각 표시됩니다.
응답 코드별 프록시 오류
측정항목
설명
<응답 코드>
지정된 기간에 Apigee 조직에 표시된 각 응답 코드를 반환한 총 프록시 오류 수입니다. 막대 위로 마우스를 가져가면 각 응답 코드를 반환한 오류 수를 확인할 수 있습니다.
응답 코드별 대상 오류
측정항목
설명
<응답 코드>
지정된 기간에 Apigee 조직에 표시된 각 응답 코드를 반환한 총 대상 오류 수입니다. 막대 위로 마우스를 가져가면 각 응답 코드를 반환한 오류 수를 확인할 수 있습니다.
[[["이해하기 쉬움","easyToUnderstand","thumb-up"],["문제가 해결됨","solvedMyProblem","thumb-up"],["기타","otherUp","thumb-up"]],[["이해하기 어려움","hardToUnderstand","thumb-down"],["잘못된 정보 또는 샘플 코드","incorrectInformationOrSampleCode","thumb-down"],["필요한 정보/샘플이 없음","missingTheInformationSamplesINeed","thumb-down"],["번역 문제","translationIssue","thumb-down"],["기타","otherDown","thumb-down"]],["최종 업데이트: 2025-08-18(UTC)"],[[["\u003cp\u003eThis Error Code Analysis dashboard in Apigee and Apigee hybrid provides insights into error rates for API proxies and targets, using response codes to calculate these rates.\u003c/p\u003e\n"],["\u003cp\u003eThe dashboard differentiates between proxy errors and target errors based on where the error occurs in the request/response flow, meaning proxy errors occur between the client and when Apigee sends to the target, while target errors are from Apigee's connection to the target.\u003c/p\u003e\n"],["\u003cp\u003eError reporting may vary between this dashboard and the API Proxy Performance dashboard because the latter relies on the \u003ccode\u003eis_error\u003c/code\u003e variable, which can be manually set, versus the response code used here.\u003c/p\u003e\n"],["\u003cp\u003eThe dashboard measures total errors, proxy errors, and target errors and further breaks them down by proxy, target, and specific response codes (4xx, 5xx), to indicate the root cause of the errors.\u003c/p\u003e\n"],["\u003cp\u003eData on this dashboard may take up to 10 minutes to update after API calls are made to the proxies, so there could be a delay.\u003c/p\u003e\n"]]],[],null,["# Error Code Analysis Dashboard\n\n*This page\napplies to **Apigee** and **Apigee hybrid**.*\n\n\n*View [Apigee Edge](https://docs.apigee.com/api-platform/get-started/what-apigee-edge) documentation.*\n\nWhat does this dashboard tell me?\n---------------------------------\n\nThe Error Code Analysis dashboard tells you about error rates for API proxies and targets.\nThe Error Code Analysis dashboard uses:\n\n- The response code to calculate proxy errors\n\n- The target response code to calculate target errors\n\nErrors reported on the Error Code Analysis dashboard might be different from errors reported\non the [API Proxy Performance dashboard](/apigee/docs/api-platform/analytics/api-proxy-performance-dashboard) because\nthat dashboard calculates error rates based on\nthe `is_error` flow variable. That variable can be explicitly set by the API proxy,\nso it is not related to the error codes in the proxy response or target response.\n\nWhen calculating error rates:\n\n- A proxy can handle a target error and still return a success response. In this case,\n the error is counted as a target error but not as a proxy error.\n\n- When the target response is either success or does not exist, but the proxy responded\n with an error, the error is counted against the proxy.\n\n- If both the proxy and target respond with an error, the error is counted on the target.\n\n\n| **Note:** **Data delay interval** \n| After API calls are made to proxies, it may take up to **10 minutes** for the data to appear in dashboards, custom reports, and management API calls.\n\n\u003cbr /\u003e\n\nThe Error Code Analysis dashboard\n---------------------------------\n\nTo access the Error Code Analysis dashboard:\n\nIn the Google Cloud console, go to the **Analytics \\\u003e API metrics \\\u003e Error Code Analysis** page.\n\n[Go to Error Code Analysis](https://console.cloud.google.com/apigee/analytics/error-analysis)\n\nThe **Error Code Analysis** view is shown:\n\nWhat does this dashboard measure?\n---------------------------------\n\n- [Error Composition](#errorcomposition)\n- [Proxy Errors](#proxyerrors)\n- [Target Errors](#targeterrors)\n- [Errors by Proxy](#errorsbyproxy)\n- [Errors by Target](#errorsbytarget)\n- [Proxy Errors by Response Code](#proxybyresponsecode)\n- [Target Errors by Response Code](#targetbyresponsecode)\n\n### Error Composition\n\n### Proxy Errors\n\n### Target Errors\n\n### Errors by Proxy\n\n### Errors by Target\n\n### Proxy Errors by Response Code\n\n### Target Errors by Response Code"]]