Questa pagina si applica ad Apigee e Apigee hybrid.
Visualizza la documentazione di
Apigee Edge.

Che cosa mi dice questa dashboard?
La dashboard Rendimento target ti aiuta a visualizzare i pattern di traffico e le metriche sul rendimento per i target di backend del proxy API.
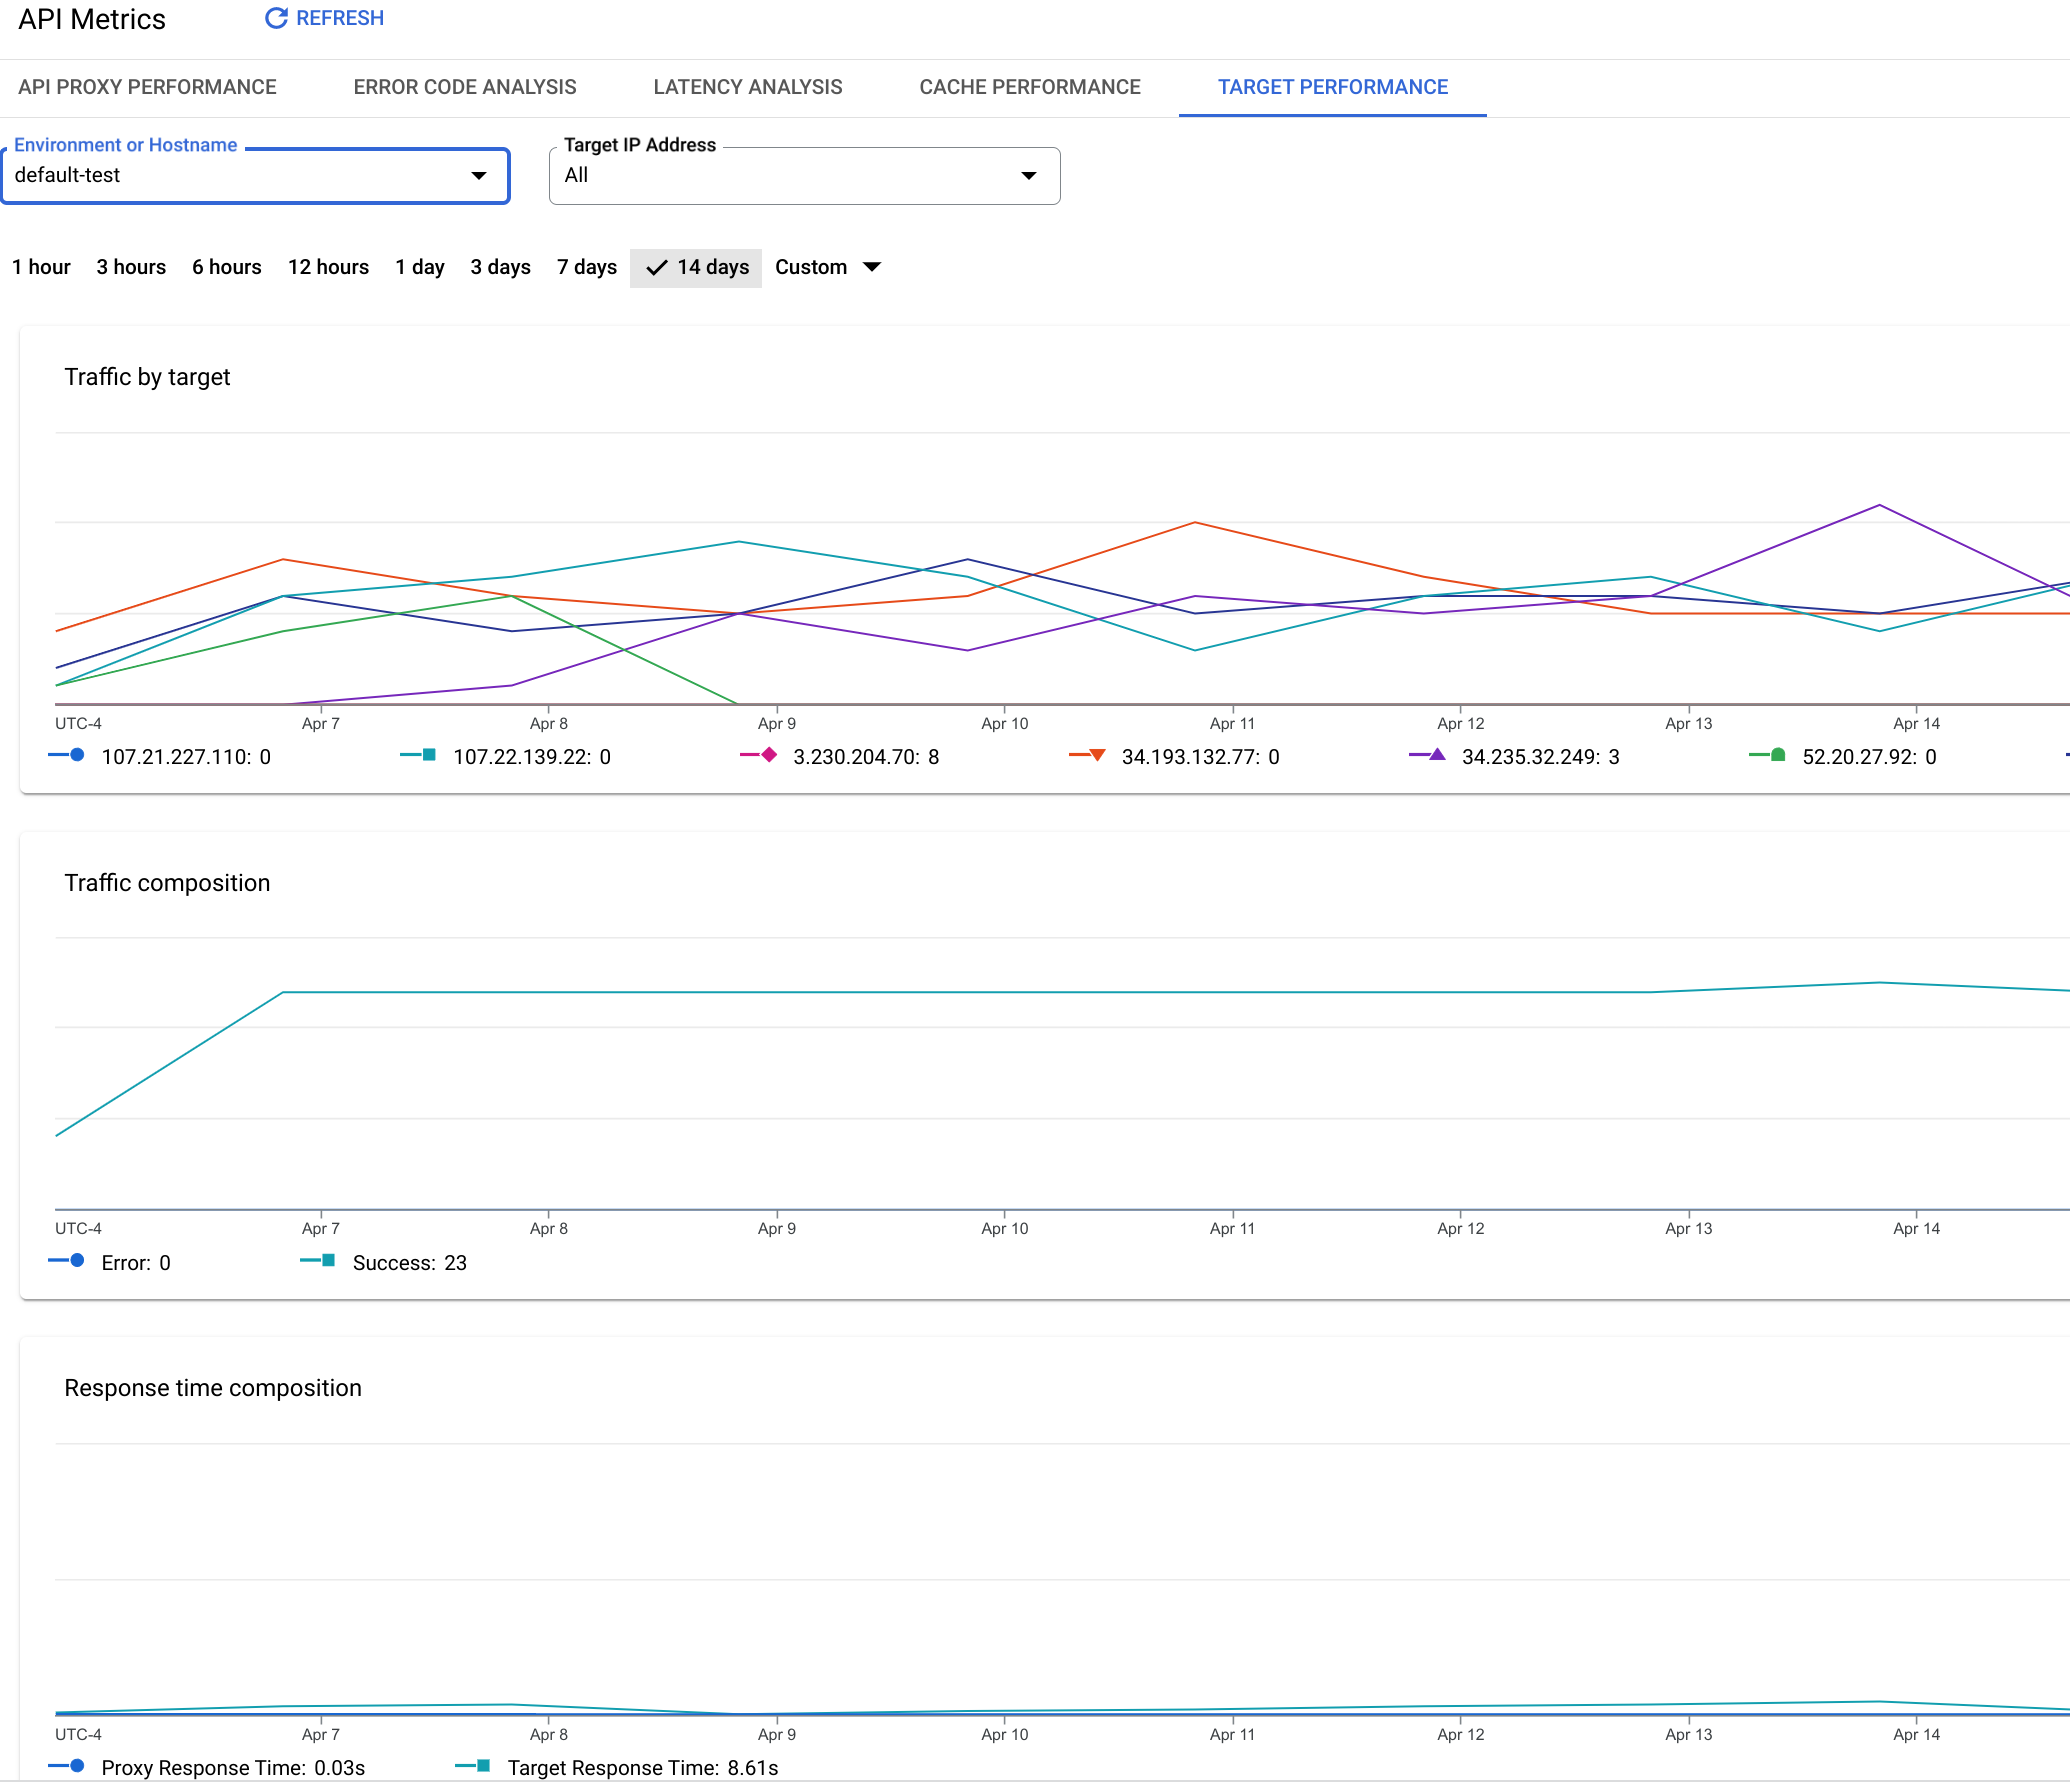
Dashboard Prestazioni target
Per accedere alla dashboard Rendimento target:
Nella console Google Cloud , vai alla pagina Analytics > Metriche API > Prestazioni target.
Viene visualizzata la visualizzazione Rendimento target:
Che cosa misura questa dashboard?
Traffico per target
| Metrica | Descrizione |
|---|---|
| Traffico di tutti i target | Misura la quantità totale di traffico che passa da Apigee a tutti i target di backend. |
| <Nome target> |
Misura la quantità totale di traffico che passa da Apigee alla destinazione di backend specificata. |
Traffico
| Metrica | Descrizione |
|---|---|
| Traffico totale | Misura la quantità totale di traffico che passa da Apigee a tutti i target di backend. Uguale a Traffico di tutte le destinazioni. |
| Errori | Il numero totale di richieste alle destinazioni di backend che hanno generato una risposta non riuscita. Le risposte di errore non vengono conteggiate. |
| Operazione riuscita | Il numero totale di tutte le richieste alle destinazioni di backend riuscite (che non restituiscono un errore). |
Tempo di risposta
Consulta anche questo interessante articolo sul sito della community Apigee: When can the Average Total Response Time be less than the Average Target Response Time?
| Metrica | Descrizione |
|---|---|
| Tempo medio |
La media del tempo di risposta totale misurato per tutte le chiamate API effettuate a un ambiente dell'organizzazione Apigee. Il tempo di risposta totale è il tempo necessario a una chiamata API ad Apigee per restituire un risultato (in millisecondi). In altre parole, il tempo di risposta totale è il tempo misurato dal momento in cui una chiamata API completa viene ricevuta su Apigee al momento in cui Apigee inizia a inviare una risposta all'app client. |
| Tempo target medio |
Il numero medio di millisecondi che intercorrono dal momento in cui l'ultimo byte di una richiesta viene inviato da Apigee a una destinazione di backend al momento in cui Apigee riceve l'ultimo byte della risposta. Misura essenzialmente il tempo che la chiamata API trascorre sul sistema di destinazione. |
| Tempo medio di proxy |
Questo valore viene calcolato come il tempo di risposta totale meno il tempo di risposta target. È fondamentalmente una misura del tempo impiegato dalla chiamata API per attraversare Apigee (in millisecondi). |
Errori di destinazione
| Metrica | Descrizione |
|---|---|
| Errori totali | Misura il numero totale di errori inviati dai target di backend ad Apigee. |
| Errori 3XX | Misura il numero totale di reindirizzamenti HTTP 3XX inviati dalle destinazioni di backend ad Apigee. |
| Errori 4XX | Misura il numero totale di errori HTTP 4XX inviati dai target di backend ad Apigee. |
| Errori 5XX | Misura il numero totale di errori HTTP 5XX inviati dalle destinazioni di backend ad Apigee. |
Dimensioni payload
| Metrica | Descrizione |
|---|---|
| Dimensioni totali payload | La dimensione totale del payload per tutte le richieste e le risposte tra Apigee e i target di backend. |
| Dimensioni payload richiesta | La dimensione totale del payload per tutte le richieste inviate da Apigee ai target di backend. |
| Dimensioni payload risposta | La dimensione totale del payload per tutte le risposte inviate dalle destinazioni di backend ad Apigee. |