Der Durchschnitt der Gesamtantwortzeit, die für alle an eine Apigee-Organisationsumgebung gesendeten API-Aufrufe gemessen wurde. Die Gesamtantwortzeit ist die Zeit, die Apigee benötigt, um einen eingegangenen API-Aufruf zu beantworten (in Millisekunden).
Oder anders ausgedrückt: Die Gesamtantwortzeit ist die Zeit, die gemessen wird, nachdem ein vollständiger API-Aufruf bei Apigee empfangen wurde, bis Apigee eine Antwort an die Client-App zu senden beginnt.
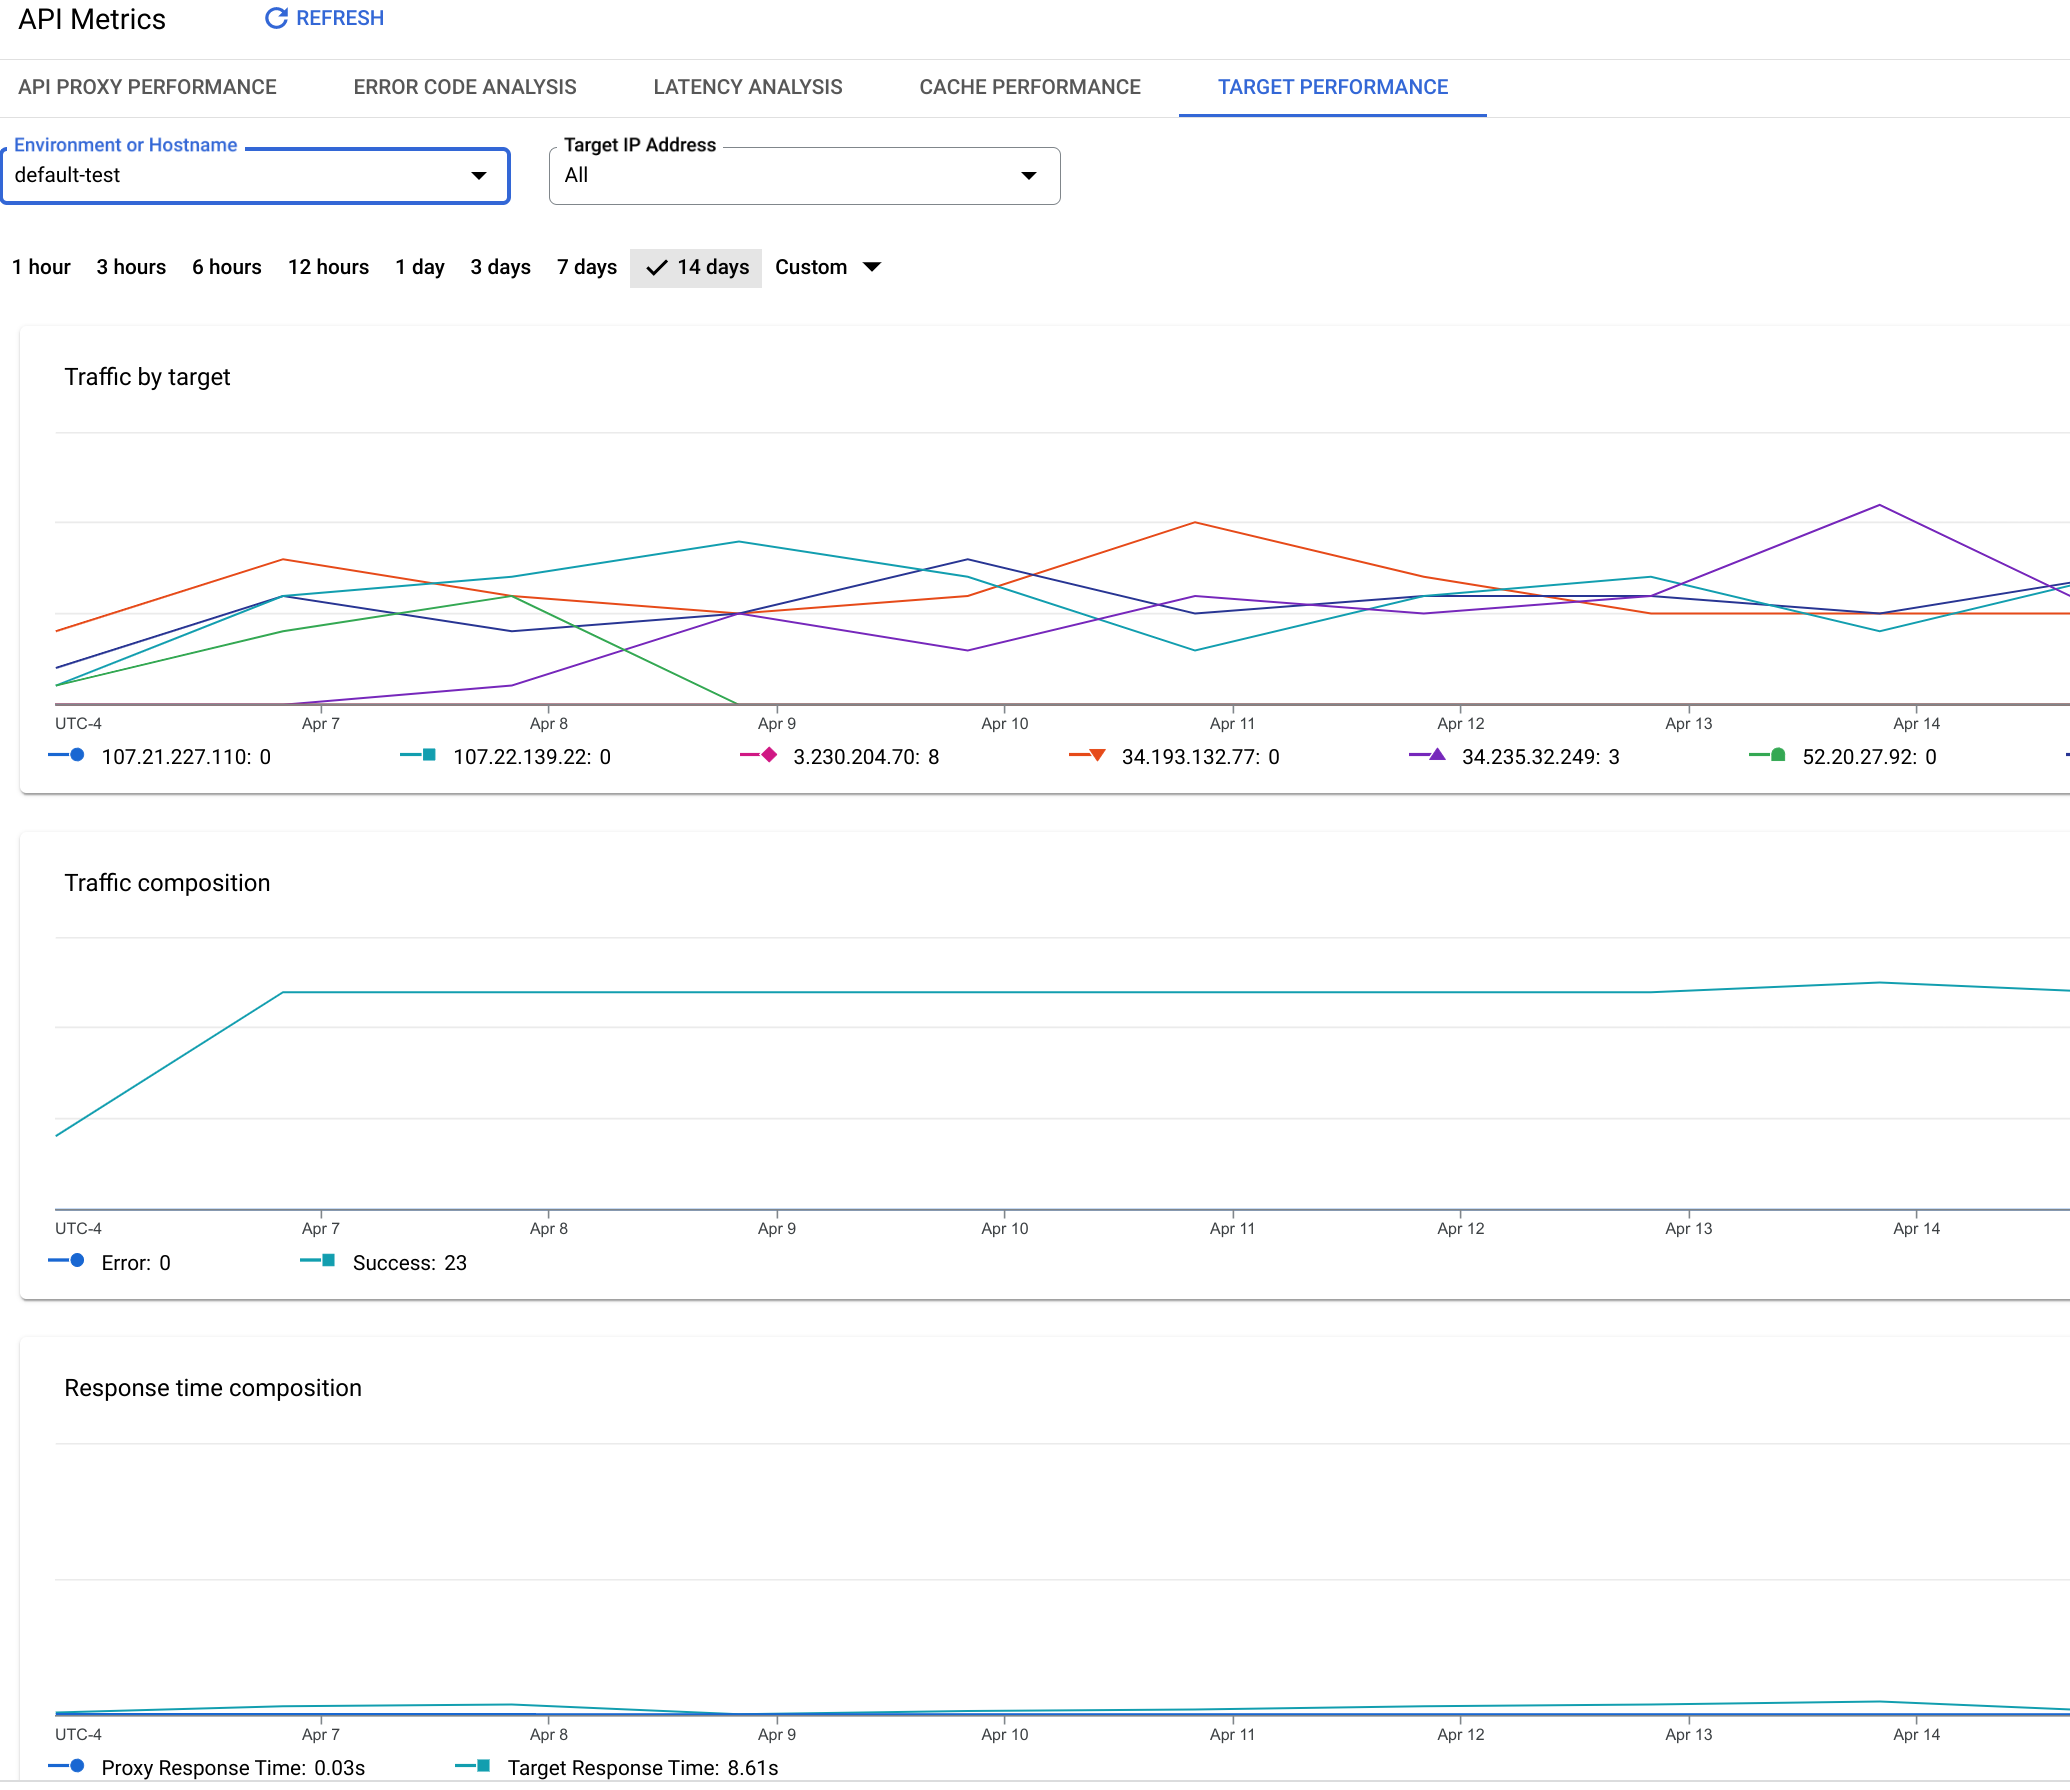
Durchschnittliche Zielzeit
Die durchschnittliche Anzahl von Millisekunden ab dem Zeitpunkt, an dem das letzte Byte einer Anfrage an ein Backend-Ziel gesendet wird, bis zu dem Zeitpunkt, an dem Apigee das letzte Byte der Antwort empfängt.
Sie misst im Wesentlichen, wie viel Zeit der API-Aufruf auf dem Zielsystem verbringt.
Durchschnittliche Proxyzeit
Dieser Wert wird als Gesamtantwortzeit abzüglich der Zielantwortzeit berechnet.
Sie ist im Grunde ein Maß dafür, wie viel Zeit API-Aufrufe Apigee selbst durchlaufen (in Millisekunden).
Zielfehler
Messwert
Beschreibung
Gesamtzahl der Fehler
Misst die Gesamtzahl der Fehler, die von Backend-Zielen an Apigee gesendet wurden.
3XX-Fehler
Misst die Gesamtzahl der HTTP 3XX-Fehler, die von Backend-Zielen an Apigee gesendet wurden.
4XX-Fehler
Misst die Gesamtzahl der HTTP 4XX-Fehler, die von Backend-Zielen an Apigee gesendet wurden.
5XX-Fehler
Misst die Gesamtzahl der HTTP 5XX-Fehler, die von Backend-Zielen an Apigee gesendet wurden.
Nutzlastgröße
Messwert
Beschreibung
Gesamtgröße der Nutzlast
Die Gesamtgröße der Nutzlast für alle Anfragen und Antworten zwischen Apigee und Backend-Zielen.
Größe der Anfragenutzlast
Die Gesamtgröße der Nutzlast für alle Anfragen, die von Apigee an Backend-Ziele gesendet wurden.
Größe der Antwortnutzlast
Die Gesamtgröße der Nutzlast für alle Antworten, die von Backend-Zielen an Apigee gesendet wurden.
[[["Leicht verständlich","easyToUnderstand","thumb-up"],["Mein Problem wurde gelöst","solvedMyProblem","thumb-up"],["Sonstiges","otherUp","thumb-up"]],[["Schwer verständlich","hardToUnderstand","thumb-down"],["Informationen oder Beispielcode falsch","incorrectInformationOrSampleCode","thumb-down"],["Benötigte Informationen/Beispiele nicht gefunden","missingTheInformationSamplesINeed","thumb-down"],["Problem mit der Übersetzung","translationIssue","thumb-down"],["Sonstiges","otherDown","thumb-down"]],["Zuletzt aktualisiert: 2025-09-04 (UTC)."],[[["\u003cp\u003eThis page details the Target Performance dashboard, which is available in both Apigee and Apigee hybrid environments, and provides insights into traffic and performance metrics related to API proxy backend targets.\u003c/p\u003e\n"],["\u003cp\u003eThe Target Performance dashboard, accessible via the Apigee UI in Cloud console or the classic Apigee UI, measures key performance metrics including traffic by target, traffic volume, response times, target errors, and payload sizes.\u003c/p\u003e\n"],["\u003cp\u003eData displayed in the dashboard might experience a delay of up to 10 minutes after API calls are made to proxies, therefore not showcasing real time information.\u003c/p\u003e\n"],["\u003cp\u003eThe dashboard tracks various error types, such as 3XX, 4XX, and 5XX errors, originating from backend targets and relayed to Apigee.\u003c/p\u003e\n"],["\u003cp\u003eResponse Time metrics include Average Time (total response time), Average Target Time (time on the target system), and Average Proxy Time (time within Apigee).\u003c/p\u003e\n"]]],[],null,["*This page\napplies to **Apigee** and **Apigee hybrid**.*\n\n\n*View [Apigee Edge](https://docs.apigee.com/api-platform/get-started/what-apigee-edge) documentation.*\n\nWhat does this dashboard tell me?\n\nThe **Target Performance** dashboard helps you visualize traffic patterns and performance metrics\nfor API proxy backend targets.\n\n\n| **Note:** **Data delay interval** \n| After API calls are made to proxies, it may take up to **10 minutes** for the data to appear in dashboards, custom reports, and management API calls.\n\n\u003cbr /\u003e\n\nThe Target Performance dashboard\n\nTo access the Target Performance dashboard:\n\n\nIn the Google Cloud console, go to the **Analytics \\\u003e API metrics \\\u003e Target Performance** page.\n\n[Go to Target Performance](https://console.cloud.google.com/apigee/analytics/target-performance)\n\nThe **Target Performance** view is shown:\n\nWhat does this dashboard measure?\n\n- [Traffic by Target](#trafficbytarget)\n- [Traffic](#traffic)\n- [Response Time](#responsetime)\n- [Target Errors](#targeterrors)\n- [Payload Size](#payloadsize)\n\nTraffic by Target\n\n| Metric | Description |\n|-------------------------|-----------------------------------------------------------------------------------------------|\n| **All Targets Traffic** | Measures the total amount of traffic that passes from Apigee to all backend targets. |\n| **\\\u003c*Target name*\\\u003e** | Measures the total amount of traffic that passes from Apigee to the specified backend target. |\n\nTraffic\n\n| Metric | Description |\n|-------------------|--------------------------------------------------------------------------------------------------------------------------|\n| **Total Traffic** | Measures the total amount of traffic that passes from Apigee to all backend targets. Same as All Targets Traffic. |\n| **Errors** | The total number of requests to backend targets that resulted in an unsuccessful response. Error responses do not count. |\n| **Success** | The total number of all requests to backend targets that are successful (that do not return an error). |\n\nResponse Time\n\nSee also this interesting article on the Apigee Community site:\n[When can the Average Total Response Time be less than the Average Target Response Time?](https://community.apigee.com/articles/2695/when-can-the-average-total-response-time-be-less-t.html)\n\n| Metric | Description |\n|-------------------------|-------------------------------------------------------------------------------------------------------------------------------------------------------------------------------------------------------------------------------------------------------------------------------------------------------------------------------------------------------------------------------------------------------------------|\n| **Average Time** | The average of the Total Response Time measured for all API calls made to an Apigee organization environment. The Total Response Time is the amount of time it takes for an API call to Apigee to return (in milliseconds). Or, put another way, total response time is the time measured from when an entire API call is received on Apigee to the time Apigee begins sending a response back to the client app. |\n| **Average Target Time** | The average number of milliseconds that it takes from the point the last byte of a request is sent from Apigee to a backend target to the time Apigee receives the last byte of the response. It's basically measuring how much time the API call spends on the target system. |\n| **Average Proxy Time** | This value is calculated as the Total Response Time minus the Target Response Time. It's basically a measure of how much time the API call spends flowing through Apigee itself (in milliseconds). |\n\nTarget Errors\n\n| Metric | Description |\n|------------------|-----------------------------------------------------------------------------------|\n| **Total Errors** | Measures the total number of errors sent from backend targets to Apigee. |\n| **3XX Errors** | Measures the total number of HTTP 3XX sent from backend targets to Apigee. |\n| **4XX Errors** | Measures the total number of HTTP 4XX errors sent from backend targets to Apigee. |\n| **5XX Errors** | Measures the total number of HTTP 5XX sent from backend targets to Apigee. |\n\nPayload Size\n\n| Metric | Description |\n|---------------------------|-------------------------------------------------------------------------------------------|\n| **Total Payload Size** | The total payload size for all requests and responses between Apigee and backend targets. |\n| **Request Payload Size** | The total payload size for all requests sent from Apigee to backend targets. |\n| **Response Payload Size** | The total payload size for all responses sent from backend targets to Apigee. |"]]