기기 대시보드는 API에 액세스하는 데 사용되는 기기와 서버에 대한 정보를 알려줍니다. 이를 통해 사용자가 API에 액세스하는 방법에 대한 트렌드를 파악할 수 있습니다. 예를 들어 다른 기기 유형의 트래픽이 감소하는 반면 한 기기 유형의 트래픽이 증가할 수 있으며, 그 다음 변경에 대한 조치가 필요한지 여부를 확인할 수 있습니다.
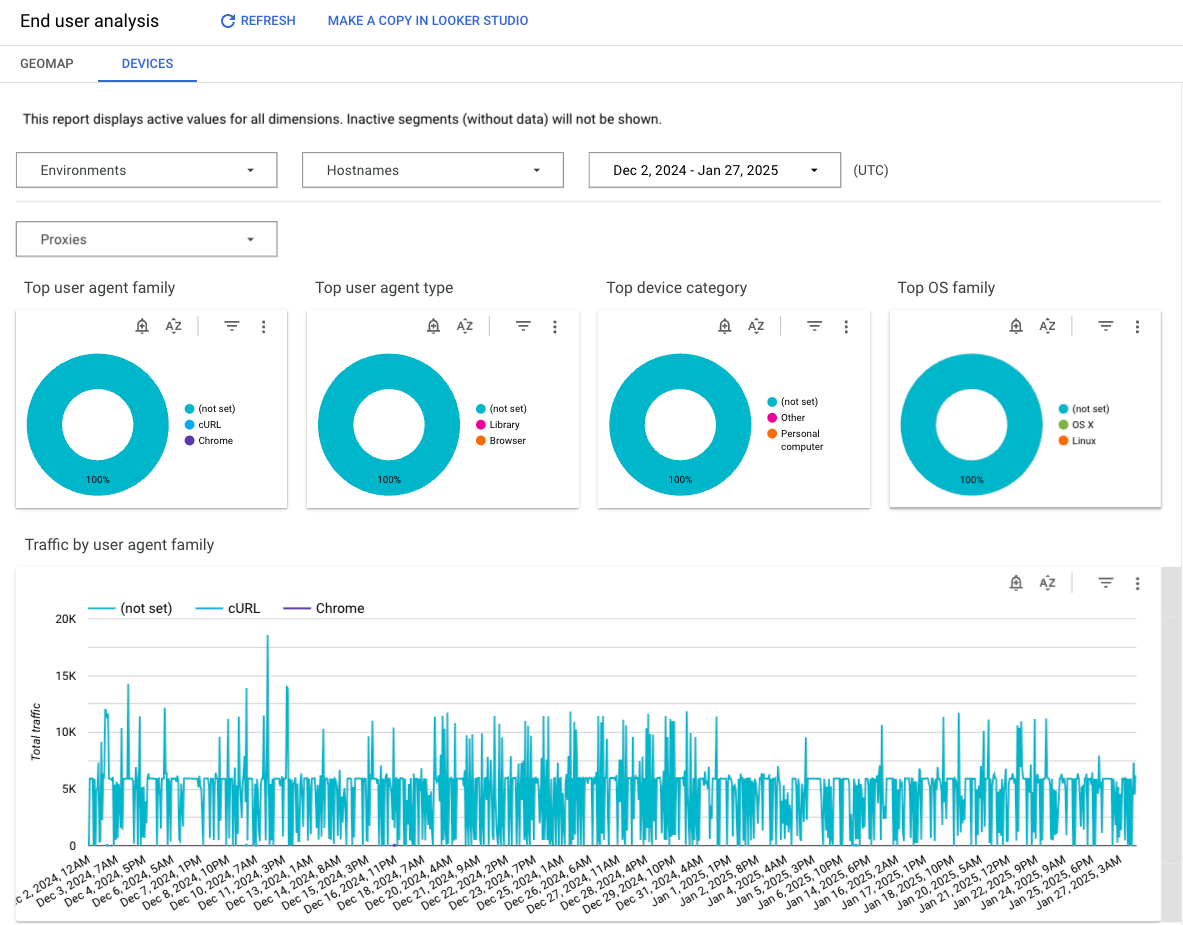
기기 대시보드
기기 대시보드에 액세스하려면 다음 안내를 따르세요.
Google Cloud 콘솔에서 애널리틱스 > 최종 사용자 분석 > 기기 페이지로 이동합니다.
대시보드에는 표시된 정보를 필터링하는 데 사용할 수 있는 드롭다운 메뉴 세트가 있습니다. 필터 드롭다운 메뉴는 동적입니다.
예를 들어 환경 드롭다운에서 환경을 선택하면 해당 환경과 연결된 모든 프록시와 호스트 이름이 다른 드롭다운 메뉴, 차트, 표에서 자동으로 선택됩니다.
자세한 내용은 Looker Studio 문서의 필터 속성 정보를 참조하세요.
날짜 선택기를 사용하여 측정할 시작일과 종료일을 선택합니다. 날짜 선택기를 사용하면 일 단위로만 날짜를 선택할 수 있습니다. 하루보다 작은 기간 단위를 선택할 수 없습니다.
그래프는 양방향입니다. 그래프 위로 마우스를 가져가면 세부정보가 표시됩니다. 그래프의 작업 메뉴를 사용하여 데이터 정렬 및 내보내기와 같은 옵션을 사용합니다.
를 참조하세요.
이 대시보드는 무엇을 측정하나요?
대시보드에는 다음 측정항목 외에도 최상위 에이전트, 에이전트 유형, 기기 유형, OS 제품군이 표시됩니다.
측정항목
설명
사용자 에이전트 제품군별 트래픽
Chrome, Safari, Firefox, cURL, IE, 기타 에이전트와 같은 특정 애플리케이션에서 들어오는 트래픽의 양을 측정합니다.
사용자 에이전트 유형별 트래픽
트래픽이 브라우저, 로봇, 라이브러리 또는 다른 에이전트에서 전송되는지 여부를 알려줍니다.
기기 카테고리별 트래픽
트래픽이 PC, 휴대기기, 기타 카테고리에서 들어오는지 알려줍니다.
이 대시보드에 관해 알아두어야 할 다른 사항은 무엇인가요?
조직의 모든 API 프록시 데이터를 보거나 프록시 드롭다운을 사용하여 분석할 개별 API를 선택할 수 있습니다. 트래픽 출처를 확인할 수 없는 경우 '기타'로 기록됩니다.
이 대시보드는 더 많은 컨텍스트를 보려면 그래프 위로 마우스를 가져가고 데이터를 CSV로 내보내는 등 날짜 및 데이터 집계 선택기와 같은 표준 컨트롤을 사용합니다. 자세한 내용은 분석 대시보드 사용을 참조하세요.
Looker Studio에서 사본 만들기
Looker Studio에서 대시보드 사본을 수정, 저장, 공유할 수 있습니다. 시작하려면 다음 안내를 따르세요.
Looker Studio에서 사본 만들기를 클릭합니다.
드롭다운 메뉴에서 복사할 보고서를 선택합니다.
Looker Studio에서 저장 및 공유를 클릭합니다.
확인 및 저장을 클릭합니다.
이제 사용자 계정에 저장된 사본을 수정할 수 있습니다. Looker Studio를 사용하여 보고서를 수정하고 만드는 방법에 대한 자세한 내용은 Looker Studio 문서를 참조하세요.
[[["이해하기 쉬움","easyToUnderstand","thumb-up"],["문제가 해결됨","solvedMyProblem","thumb-up"],["기타","otherUp","thumb-up"]],[["이해하기 어려움","hardToUnderstand","thumb-down"],["잘못된 정보 또는 샘플 코드","incorrectInformationOrSampleCode","thumb-down"],["필요한 정보/샘플이 없음","missingTheInformationSamplesINeed","thumb-down"],["번역 문제","translationIssue","thumb-down"],["기타","otherDown","thumb-down"]],["최종 업데이트: 2025-08-18(UTC)"],[[["\u003cp\u003eThis Devices dashboard, available for Apigee and Apigee hybrid, provides insights into the devices and servers accessing your APIs, helping you identify user access trends.\u003c/p\u003e\n"],["\u003cp\u003eAccessing the dashboard requires specific IAM predefined roles such as \u003ccode\u003eroles/apigee.analyticsViewer\u003c/code\u003e, \u003ccode\u003eroles/apigee.analyticsEditor\u003c/code\u003e, or \u003ccode\u003eroles/apigee.addonsconfig.get\u003c/code\u003e.\u003c/p\u003e\n"],["\u003cp\u003eThe dashboard allows filtering of data through dynamic dropdown menus and using the date selector to select specific time periods for analysis, however, the date selector only lets you select dates in day increments.\u003c/p\u003e\n"],["\u003cp\u003eThe Devices dashboard measures traffic metrics such as user agent family, user agent type, and device category to show the top agents and their traffic activity.\u003c/p\u003e\n"],["\u003cp\u003eUsers can make a copy of the dashboard in Looker Studio to edit, save, and share, but any changes made in Looker Studio will not be reflected in the original Apigee dashboard.\u003c/p\u003e\n"]]],[],null,["*This page\napplies to **Apigee** and **Apigee hybrid**.*\n\n\n*View [Apigee Edge](https://docs.apigee.com/api-platform/get-started/what-apigee-edge) documentation.*\n\n| **Dashboard availability:** This dashboard is not available if your Apigee organization was provisioned with compliance-related Apigee features, such as [data residency](/apigee/docs/api-platform/get-started/drz-concepts), [CMEK](/apigee/docs/api-platform/get-started/cmek-concepts), and [workforce identity federation](/apigee/docs/api-platform/system-administration/workforce-identity-federation-apigee#accessing-features-only-available-in-the-classic-apigee-ui).\n\nWhat does this dashboard tell me?\n\nThe Devices dashboard tells you about the devices and servers that are being used to access\nyour APIs. It lets you spot trends in how users are accessing your APIs. For instance, you might\nnotice that traffic from one type of device is increasing, while another is going down, and then\ndecide if the change requires any action or not.\n\n\n| **Note:** **Data delay interval** \n| After API calls are made to proxies, it may take up to **10 minutes** for the data to appear in dashboards, custom reports, and management API calls.\n\n\u003cbr /\u003e\n\nThe Devices dashboard **Required roles:** To access the **Devices** dashboard, you must have the following IAM predefined roles:\n|\n| - `roles/apigee.analyticsViewer`\n| - `roles/apigee.analyticsEditor`\n| - `roles/apigee.addonsconfig.get`\n|\n| For more information, see [How to specify a predefined role](/apigee/docs/api-platform/get-started/permissions#expandable-1).\n\nTo access the Devices dashboard:\n\nIn the Google Cloud console, go to the **Analytics \\\u003e End user analysis \\\u003e Devices** page.\n\n[Go to Devices](https://console.cloud.google.com//apigee/analytics/enduser/devices)\n\nThe dashboard opens as shown:\n\nUsing the dashboard\n\nThe dashboard has a set of dropdown menus that you\ncan use to filter the information shown in it. The filter dropdown menus are dynamic.\nFor example, if you select an environment from the Environments dropdown, then any proxies,\nand hostnames\nassociated with that environment are automatically selected in the other dropdown menus, charts, and tables.\nFor more information, see\n[About filter properties](/looker/docs/studio/about-filter-properties) in\nthe Looker Studio documentation.\n\nUse the date selector to pick a start and end date to measure. The date selector only\nlets you select dates in day increments. You can't select a time range increment\nthat is smaller than a day.\n\nThe graphs are interactive. Hover over a graph to see more details. Use the\naction menu in a graph for options like sorting and exporting data.\n| **Note:** Seeing a dimension entity named ***(not set)*** ? For more information, see [What does an analytics entity named (not set) mean?](/apigee/docs/api-platform/analytics/why-am-i-seeing-analytics-entity-named-not-set)\n\nWhat does this dashboard measure?\n\nIn addition to the following metrics, the dashboard shows the top agents, agent types, device\ntypes, and OS families.\n\n| Metric | Description |\n|------------------------------|-----------------------------------------------------------------------------------------------------------------------------------|\n| Traffic by user agent family | Measures how much traffic is coming from a specific application, like Google Chrome, Safari, Firefox, cURL, IE, and other agents. |\n| Traffic by user agent type | Tells you if traffic is coming from a browser, a robot, a library, or other agents. |\n| Traffic by device category | Tells you if traffic is coming from a PC, a mobile device, and other categories. |\n\nWhat else do I need to know about this\ndashboard?\n\nYou can view data for all API proxies in your organization, or you can use the **Proxies**\ndrop-down to select individual APIs to analyze. When traffic origination cannot be determined,\nit is recorded as \"Others\".\n\nThis dashboard uses standard controls, like the date and data aggregation selectors, hovering\nover graphs for more context, exporting data to CSV, and so on. To learn more, see\n[Using the analytics\ndashboards](/apigee/docs/api-platform/analytics/using-analytics-dashboards).\n\nMake a copy in Looker Studio\n\nYou can edit, save, and share a copy of the dashboard in\n[Looker Studio](/looker/docs/studio/new-studio-docs). To get started:\n\n1. Click **Make a copy in Looker Studio**.\n2. From the dropdown menu, select the report you wish to copy.\n3. In Looker Studio, click **Save and share**.\n4. Click **Acknowledge and save**.\n\nYou can now edit the copy saved in your user account. For details on using\nLooker Studio to edit and create reports, see the [Looker Studio\ndocumentation](/looker/docs/studio/about-reports).\n| **Note:** Any changes you make in Looker Studio are not reflected back in the Apigee dashboard."]]