本页面适用于 Apigee 和 Apigee Hybrid。
查看 Apigee Edge 文档。

此信息中心可以提供什么信息?
设备信息中心会显示用于访问 API 的设备和服务器。它可让您发现用户如何访问您的 API 的趋势。例如,您可能会注意到,来自某种类型设备的流量在不断增加,而另一种流量正在下滑,然后决定是否需要执行任何操作。
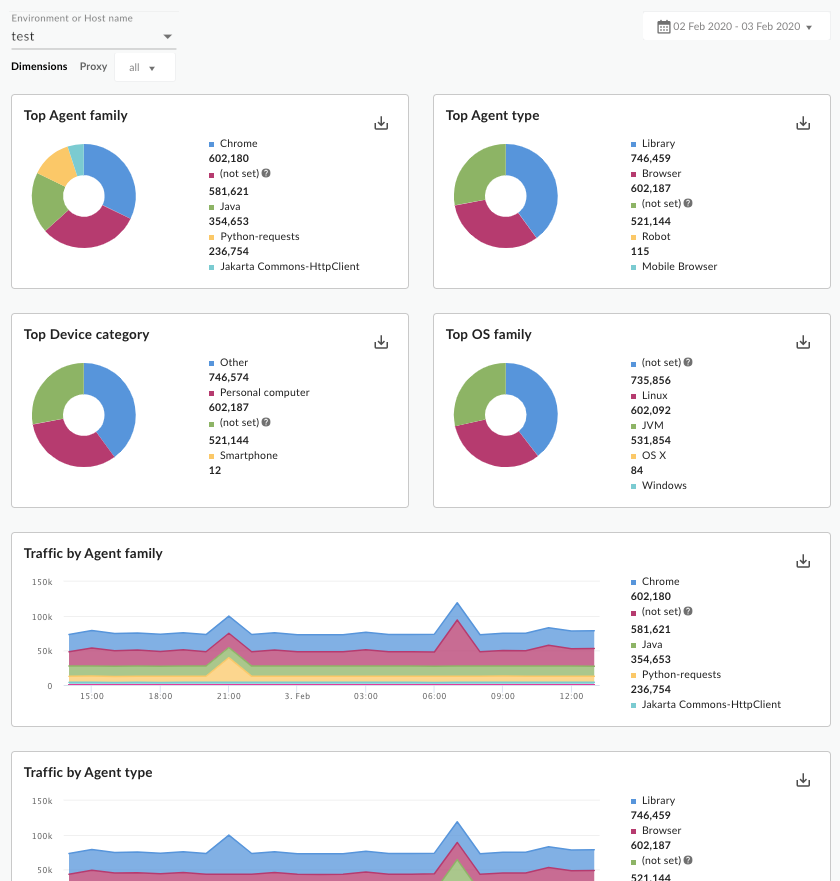
设备信息中心
要访问设备信息中心,请执行以下操作:
在 Google Cloud 控制台中,前往 Analytics > 最终用户分析 > 设备页面。
信息中心将打开,如下所示:
使用信息中心
信息中心包含一组下拉菜单,您可以使用这些下拉菜单过滤其中显示的信息。过滤条件下拉菜单是动态的。 例如,如果您从“环境”下拉菜单中选择一个环境,则与该环境关联的所有代理和主机名都会在其他下拉菜单、图表和表格中自动选中。 如需了解详情,请参阅 Looker Studio 文档中的过滤条件属性简介。
使用日期选择器选择要衡量的开始日期和结束日期。日期选择器仅允许您以天为增量选择日期。您无法选择小于一天的时间范围增量。
图表是交互式的。将鼠标悬停在图表上可查看更多详细信息。使用图表中的操作菜单以查看数据排序和导出等选项。
此信息中心衡量的是什么?
除了以下指标外,信息中心还会显示主要代理、代理类型、设备类型和操作系统系列。
| 指标 | 说明 |
|---|---|
| 按用户代理系列划分的流量 | 衡量来自 Google Chrome、Safari、Firefox、cURL、IE 和其他代理等特定应用的流量。 |
| 按用户代理类型划分的流量 | 告知您流量是来自浏览器、机器人、库还是其他代理。 |
| 按设备类别划分的流量 | 告知您流量是否来自 PC、移动设备和其他类别。 |
关于此信息中心,还需要了解哪些信息?
您可以查看组织中所有 API 代理的数据,也可以使用代理下拉列表选择要分析的单独的 API。如果无法确定流量来源,它会被记录为“其他”。
此信息中心使用标准控件,例如日期和数据聚合选择器、将鼠标悬停在图表上查看更多上下文,以及将数据导出为 CSV 等。如需了解详情,请参阅使用分析信息中心。
在 Looker Studio 中创建副本
您可以在 Looker Studio 中修改、保存和共享信息中心副本。要开始使用,请执行以下操作:
- 点击在 Looker Studio 中制作副本。
- 从下拉菜单中选择要复制的报告。
- 在 Looker Studio 中,点击保存并共享。
- 点击确认并保存。
现在,您可以修改以您的用户账号保存的副本。如需详细了解如何使用 Looker Studio 修改和创建报告,请参阅 Looker Studio 文档。