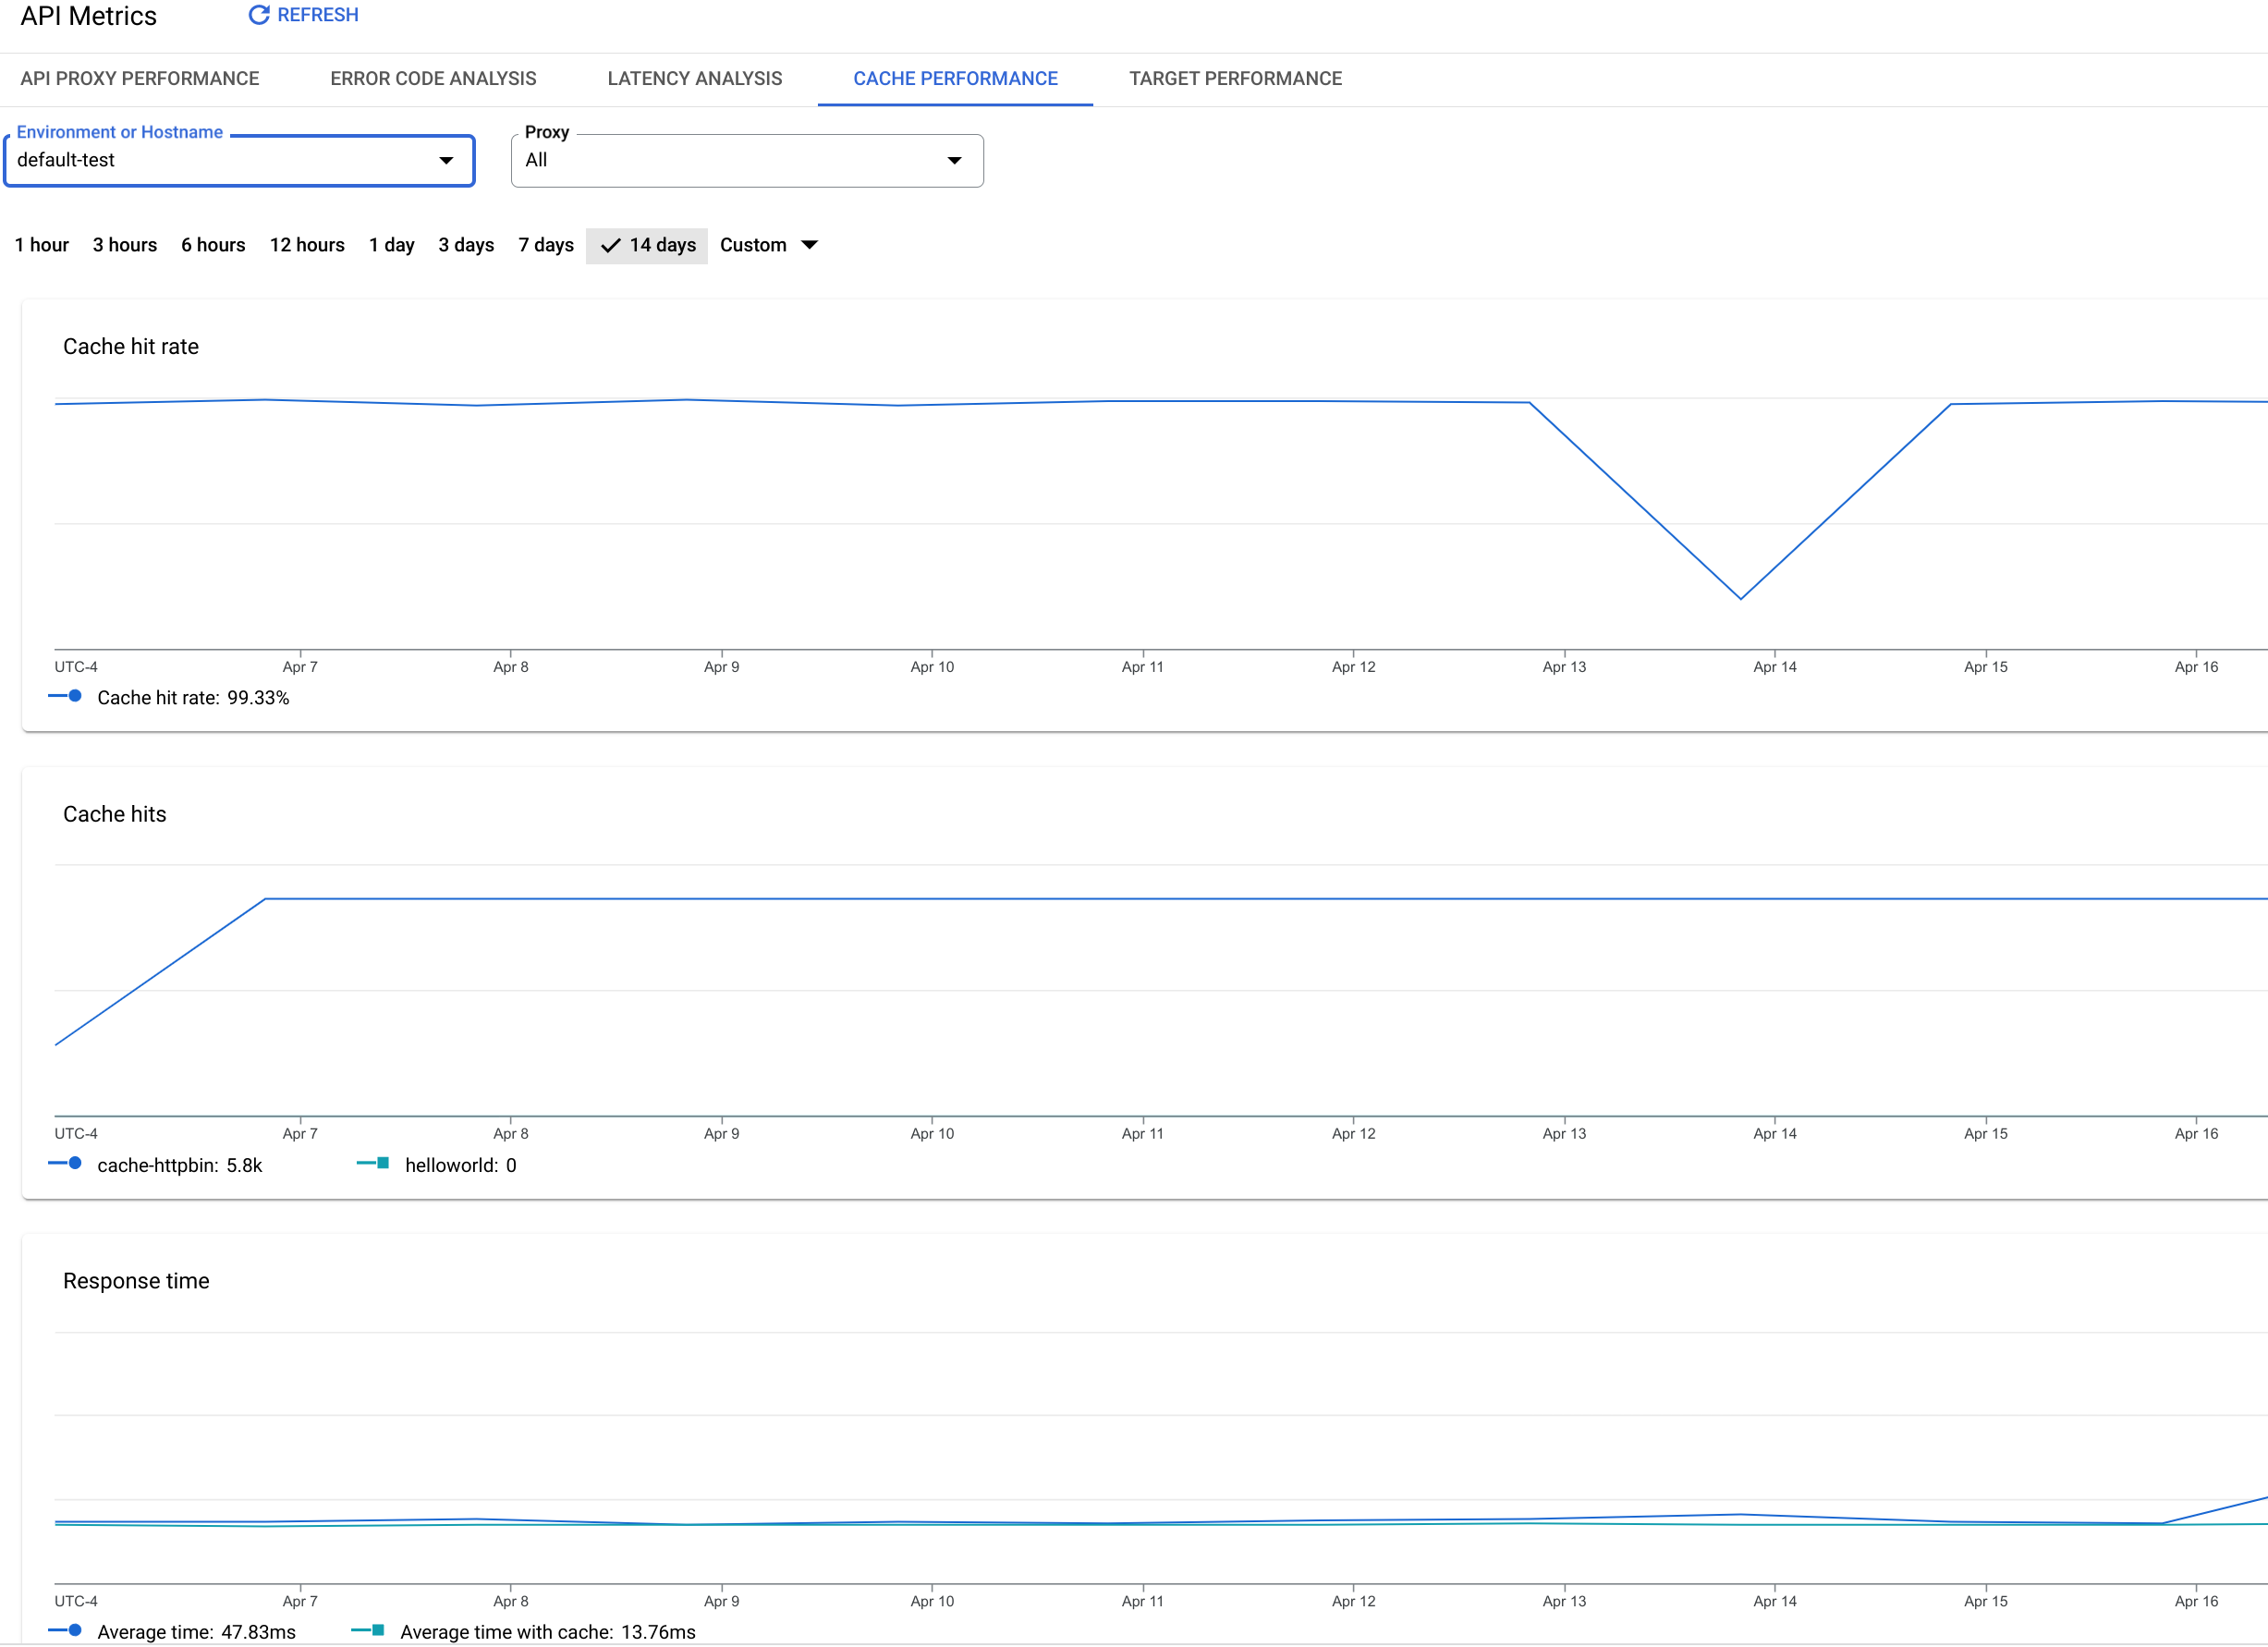
Im Cache-Dashboard zur Leistungsüberwachung können Sie den Wert des Antwort-Cache auf einen Blick sehen.
Mithilfe des Dashboards können Sie die Vorteile des Antwortcaches im Hinblick auf niedrigere Latenzzeiten und geringere Last auf dem Backend-Server visualisieren.
Das Cache Performance-Dashboard
So greifen Sie auf das Cache-Dashboard zur Leistungsüberwachung zu:
Rufen Sie in der Google Cloud Console die Seite Analysen > API-Messwerte > Cache-Leistung auf.
[[["Leicht verständlich","easyToUnderstand","thumb-up"],["Mein Problem wurde gelöst","solvedMyProblem","thumb-up"],["Sonstiges","otherUp","thumb-up"]],[["Schwer verständlich","hardToUnderstand","thumb-down"],["Informationen oder Beispielcode falsch","incorrectInformationOrSampleCode","thumb-down"],["Benötigte Informationen/Beispiele nicht gefunden","missingTheInformationSamplesINeed","thumb-down"],["Problem mit der Übersetzung","translationIssue","thumb-down"],["Sonstiges","otherDown","thumb-down"]],["Zuletzt aktualisiert: 2025-10-02 (UTC)."],[],[]]