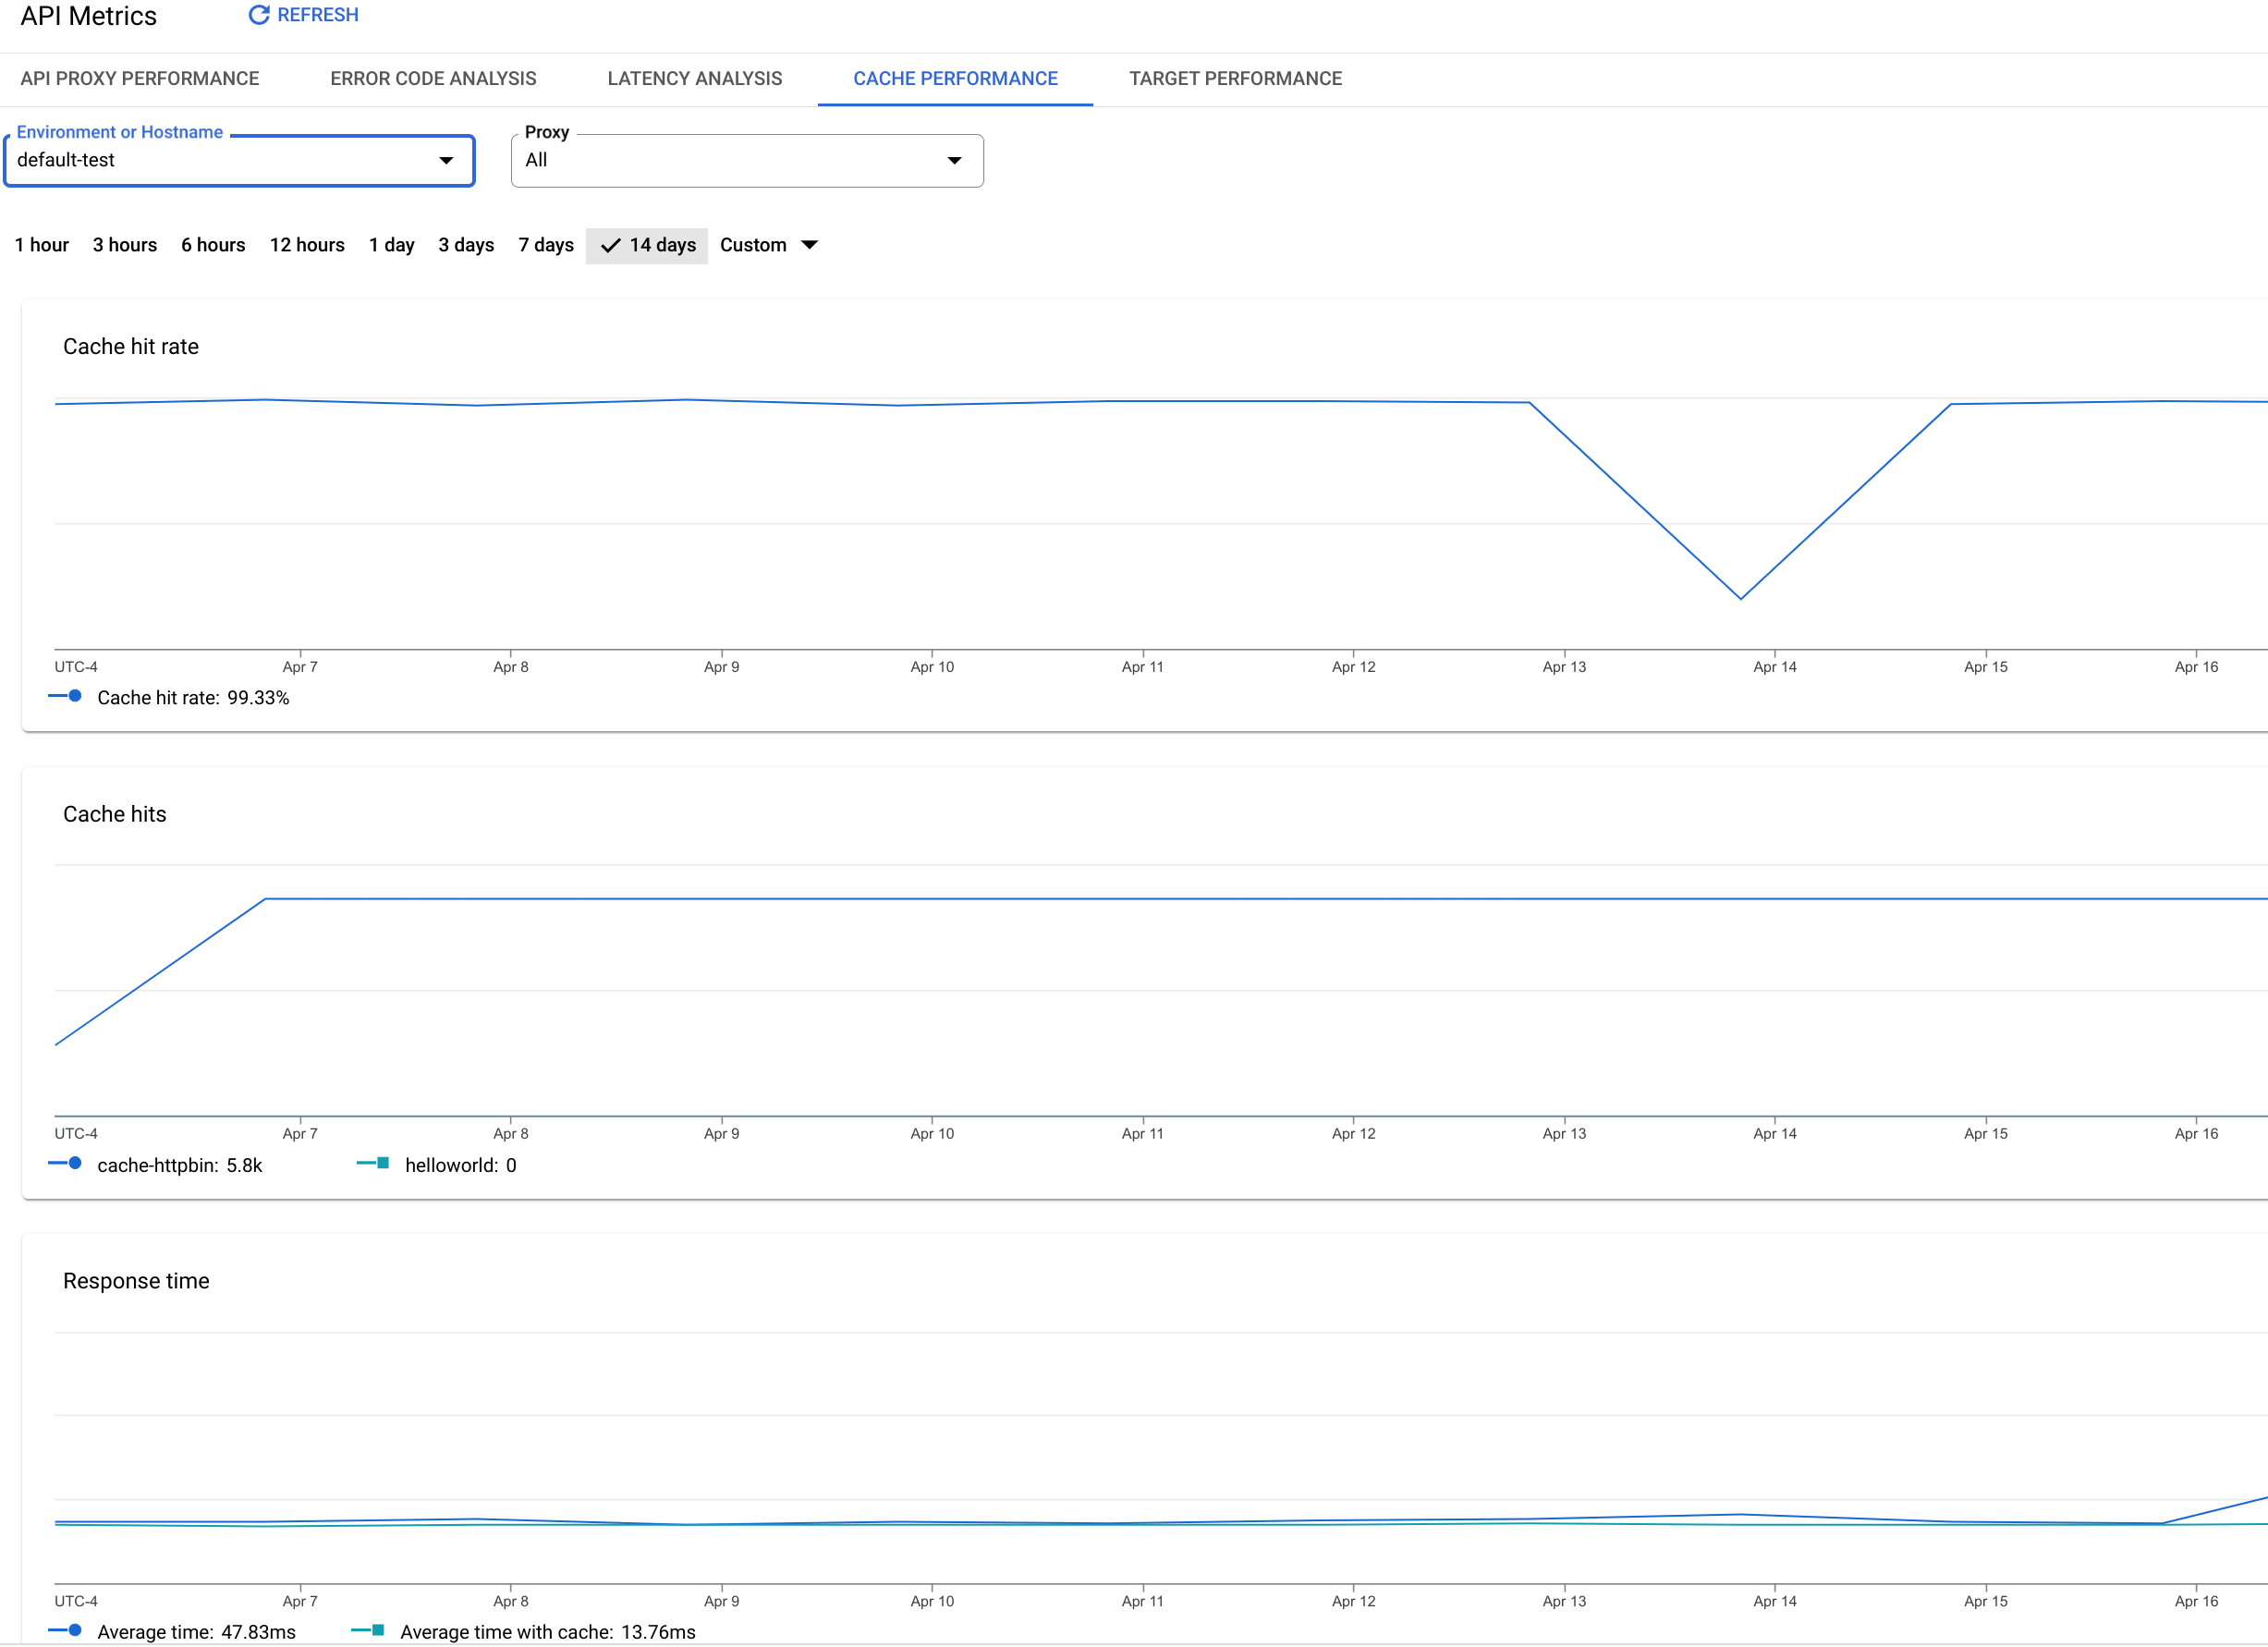
O painel "Desempenho do cache" permite que você veja rapidamente o valor do cache de resposta.
O painel ajuda a visualizar os benefícios do cache de resposta em termos de menor latência e servidores de
back-end de carga reduzidos.
Painel "Desempenho do cache"
Para acessar o painel de desempenho do cache:
No console do Google Cloud , acesse a página Analytics > Métricas da API > Desempenho do cache.
[[["Fácil de entender","easyToUnderstand","thumb-up"],["Meu problema foi resolvido","solvedMyProblem","thumb-up"],["Outro","otherUp","thumb-up"]],[["Difícil de entender","hardToUnderstand","thumb-down"],["Informações incorretas ou exemplo de código","incorrectInformationOrSampleCode","thumb-down"],["Não contém as informações/amostras de que eu preciso","missingTheInformationSamplesINeed","thumb-down"],["Problema na tradução","translationIssue","thumb-down"],["Outro","otherDown","thumb-down"]],["Última atualização 2025-10-02 UTC."],[],[]]