O painel de controlo do desempenho da cache permite-lhe ver rapidamente o valor da cache de respostas.
O painel de controlo ajuda a visualizar a vantagem da cache de respostas em termos de latência mais baixa e redução dos servidores de back-end de carregamento.
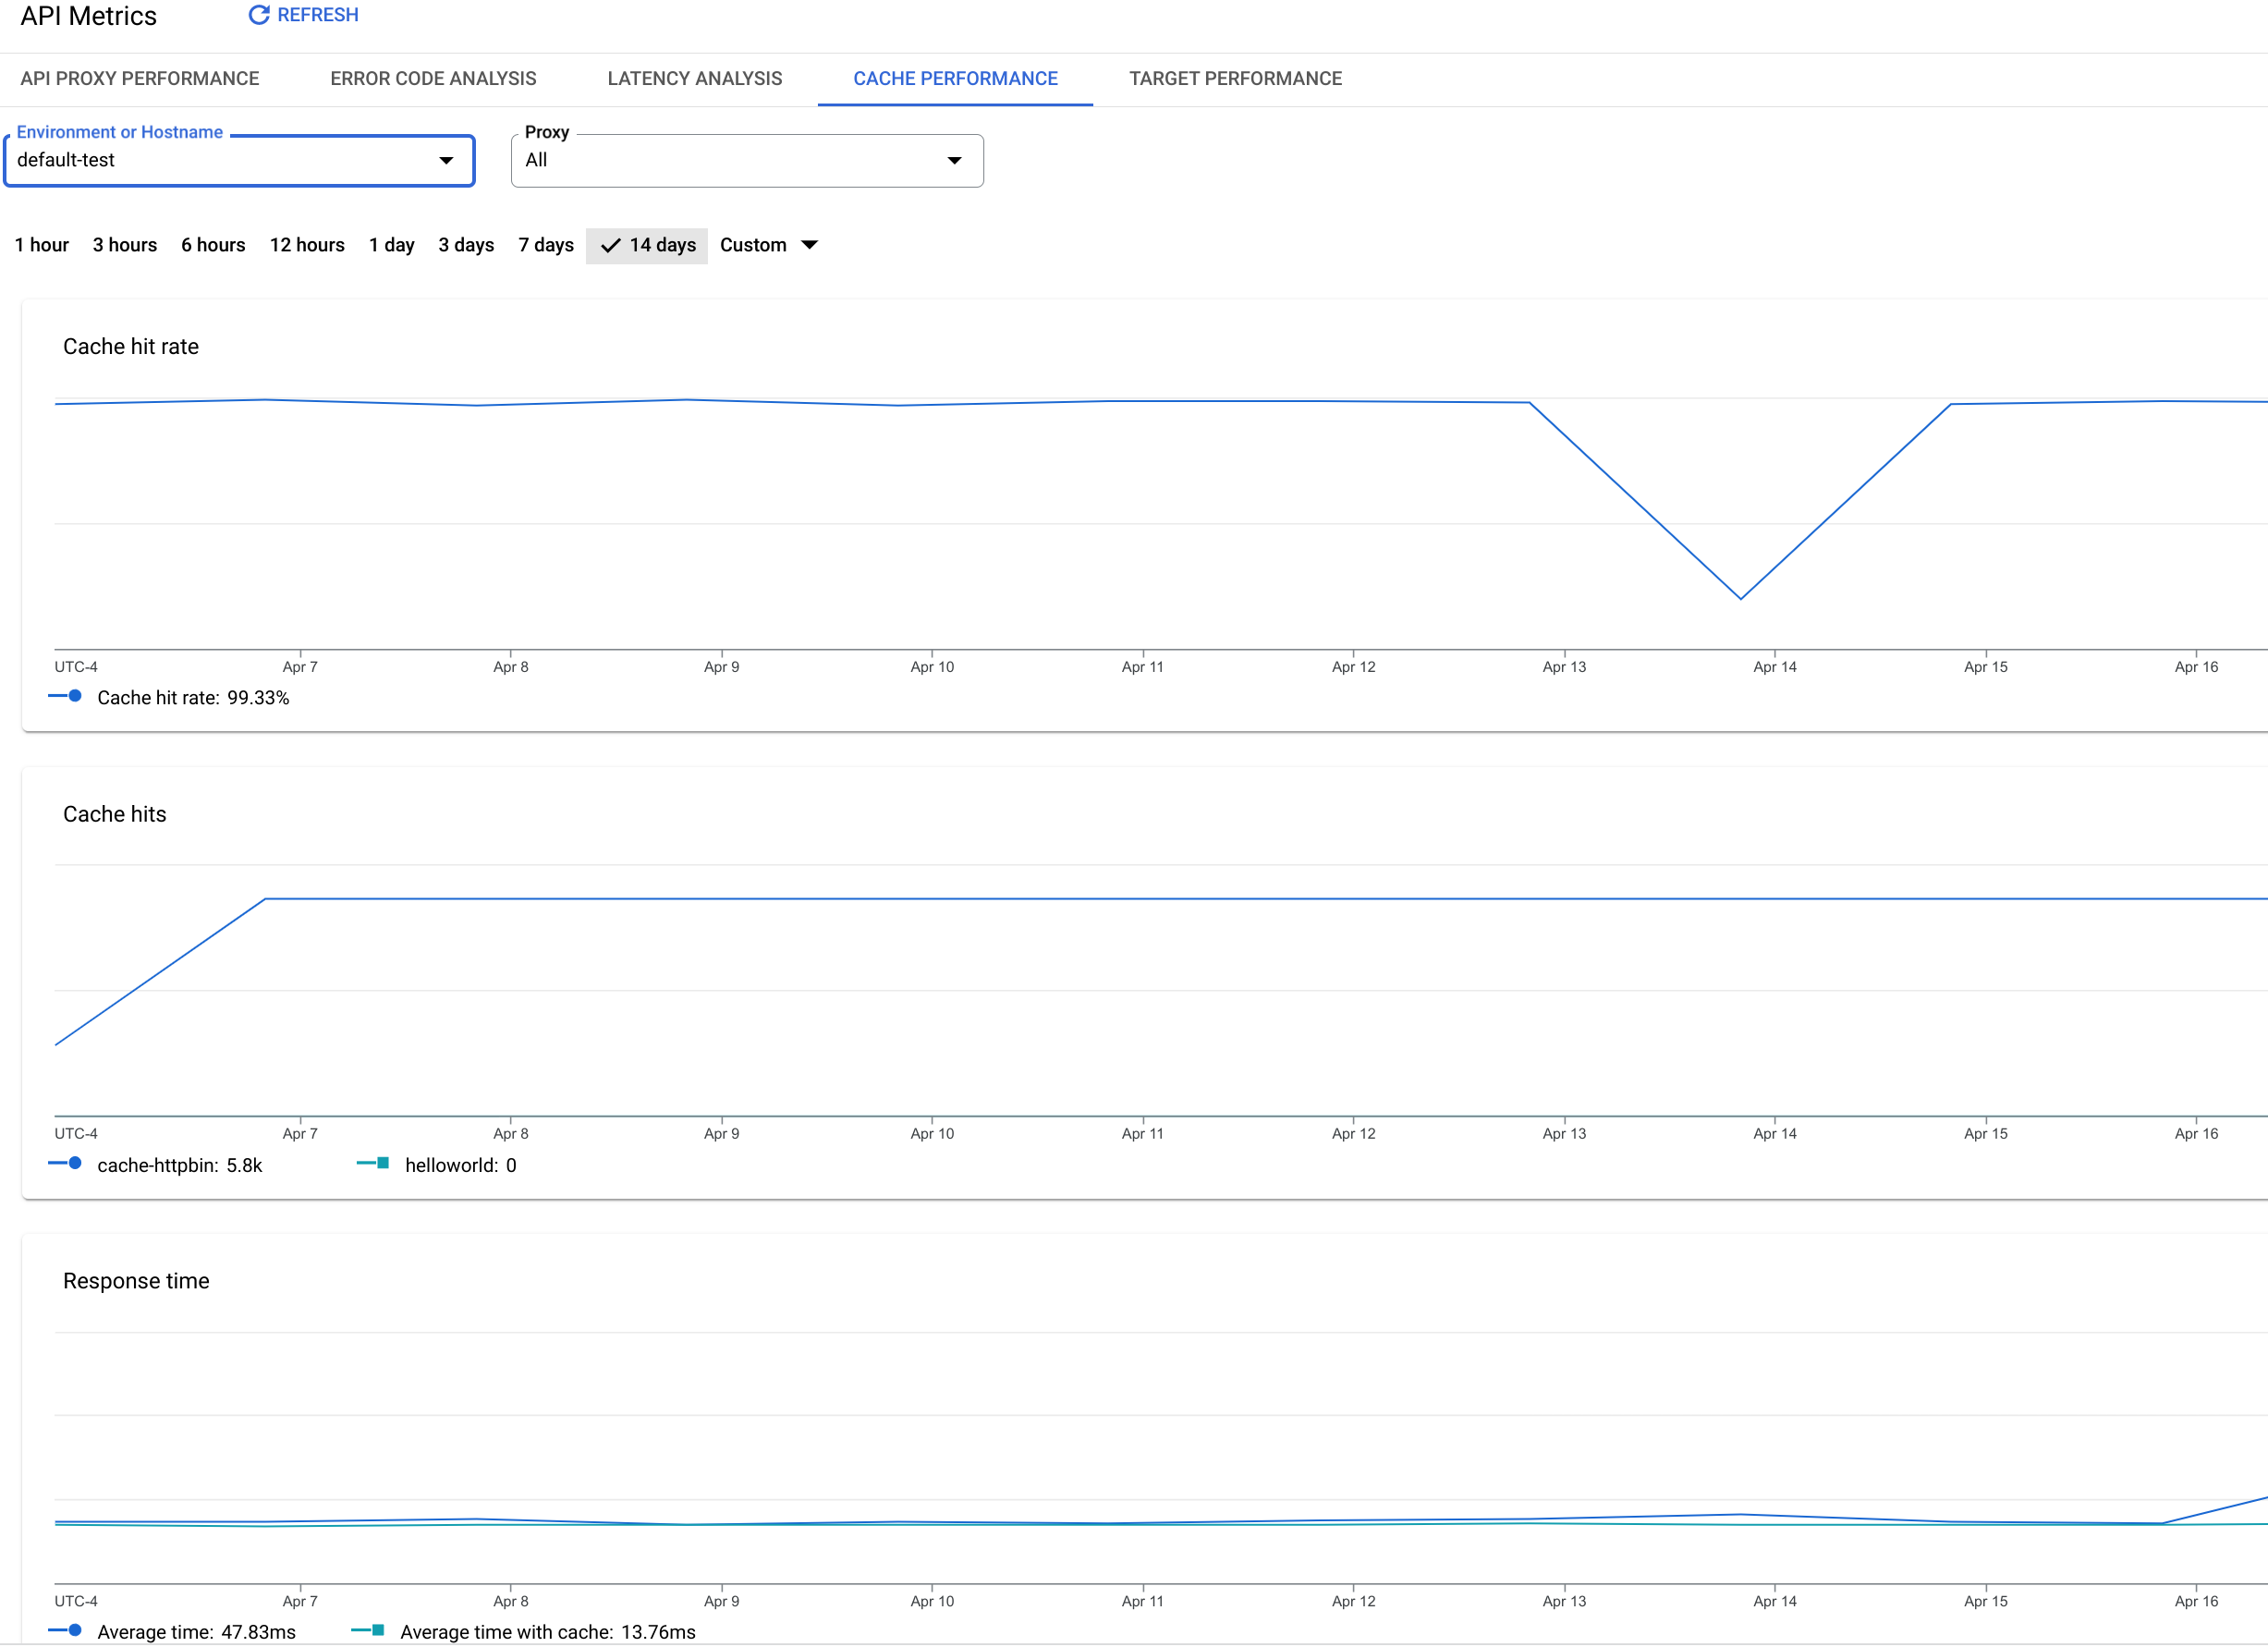
O painel de controlo de desempenho da cache
Para aceder ao painel de controlo de desempenho da cache:
Na Google Cloud consola, aceda a Analytics > Métricas da API > Desempenho da cache.
[[["Fácil de entender","easyToUnderstand","thumb-up"],["Meu problema foi resolvido","solvedMyProblem","thumb-up"],["Outro","otherUp","thumb-up"]],[["Difícil de entender","hardToUnderstand","thumb-down"],["Informações incorretas ou exemplo de código","incorrectInformationOrSampleCode","thumb-down"],["Não contém as informações/amostras de que eu preciso","missingTheInformationSamplesINeed","thumb-down"],["Problema na tradução","translationIssue","thumb-down"],["Outro","otherDown","thumb-down"]],["Última atualização 2025-08-21 UTC."],[[["\u003cp\u003eThis page focuses on the Cache Performance dashboard within Apigee and Apigee hybrid.\u003c/p\u003e\n"],["\u003cp\u003eThe dashboard visualizes the effectiveness of the ResponseCache policy, but not LookupCache or PopulateCache policies.\u003c/p\u003e\n"],["\u003cp\u003eYou can access the Cache Performance dashboard through the Apigee UI in the Cloud console or the classic Apigee UI.\u003c/p\u003e\n"],["\u003cp\u003eThe dashboard measures metrics like average cache hit rate, cache hits by API proxy, and average time with and without the cache.\u003c/p\u003e\n"],["\u003cp\u003eData in the dashboard may take up to 10 minutes to appear after API calls, and performance ratios may be temporarily inaccurate with new data.\u003c/p\u003e\n"]]],[],null,["# Cache performance dashboard\n\n*This page\napplies to **Apigee** and **Apigee hybrid**.*\n\n\n*View [Apigee Edge](https://docs.apigee.com/api-platform/get-started/what-apigee-edge) documentation.*\n\nWhat does this dashboard tell me?\n---------------------------------\n\nThe Cache Performance dashboard collects data from the\n[ResponseCache policy](/apigee/docs/api-platform/reference/policies/response-cache-policy).\nThis dashboard does not collect data from the [LookupCache](/apigee/docs/api-platform/reference/policies/lookup-cache-policy)\nor [PopulateCache](/apigee/docs/api-platform/reference/policies/populate-cache-policy) policies.\n\nThe Cache Performance dashboard lets you see at a glance the value of the response cache.\nThe dashboard helps you visualize the benefit of the response cache in terms of lower latency and reduced\nload backend servers.\n\n\n| **Note:** **Data delay interval** \n| After API calls are made to proxies, it may take up to **10 minutes** for the data to appear in dashboards, custom reports, and management API calls.\n\n\u003cbr /\u003e\n\nThe Cache Performance dashboard\n-------------------------------\n\nTo access the Cache Performance dashboard:\n\nIn the Google Cloud console, go to the **Analytics \\\u003e API metrics \\\u003e Cache Performance** page.\n\n[Go to Cache Performance](https://console.cloud.google.com/apigee/analytics/cache-performance)\n\n\u003cbr /\u003e\n\nThe **Cache Performance** view is shown:\n\nWhat does this dashboard measure?\n---------------------------------\n\n| **Note:** The performance ratios may appear incorrect for the first few minutes for new data. This is because with a small number of data points, there can be a difference in the number of data points being compared to create the ratios. This inconsistency will resolve itself within a few minutes as it collects more data points. If the performance ratios still appear incorrect, refresh the page."]]