Le tableau de bord "Performances du cache" collecte les données de la règle ResponseCache.
Ce tableau de bord ne collecte pas de données à partir des règles LookupCache ni PopulateCache.
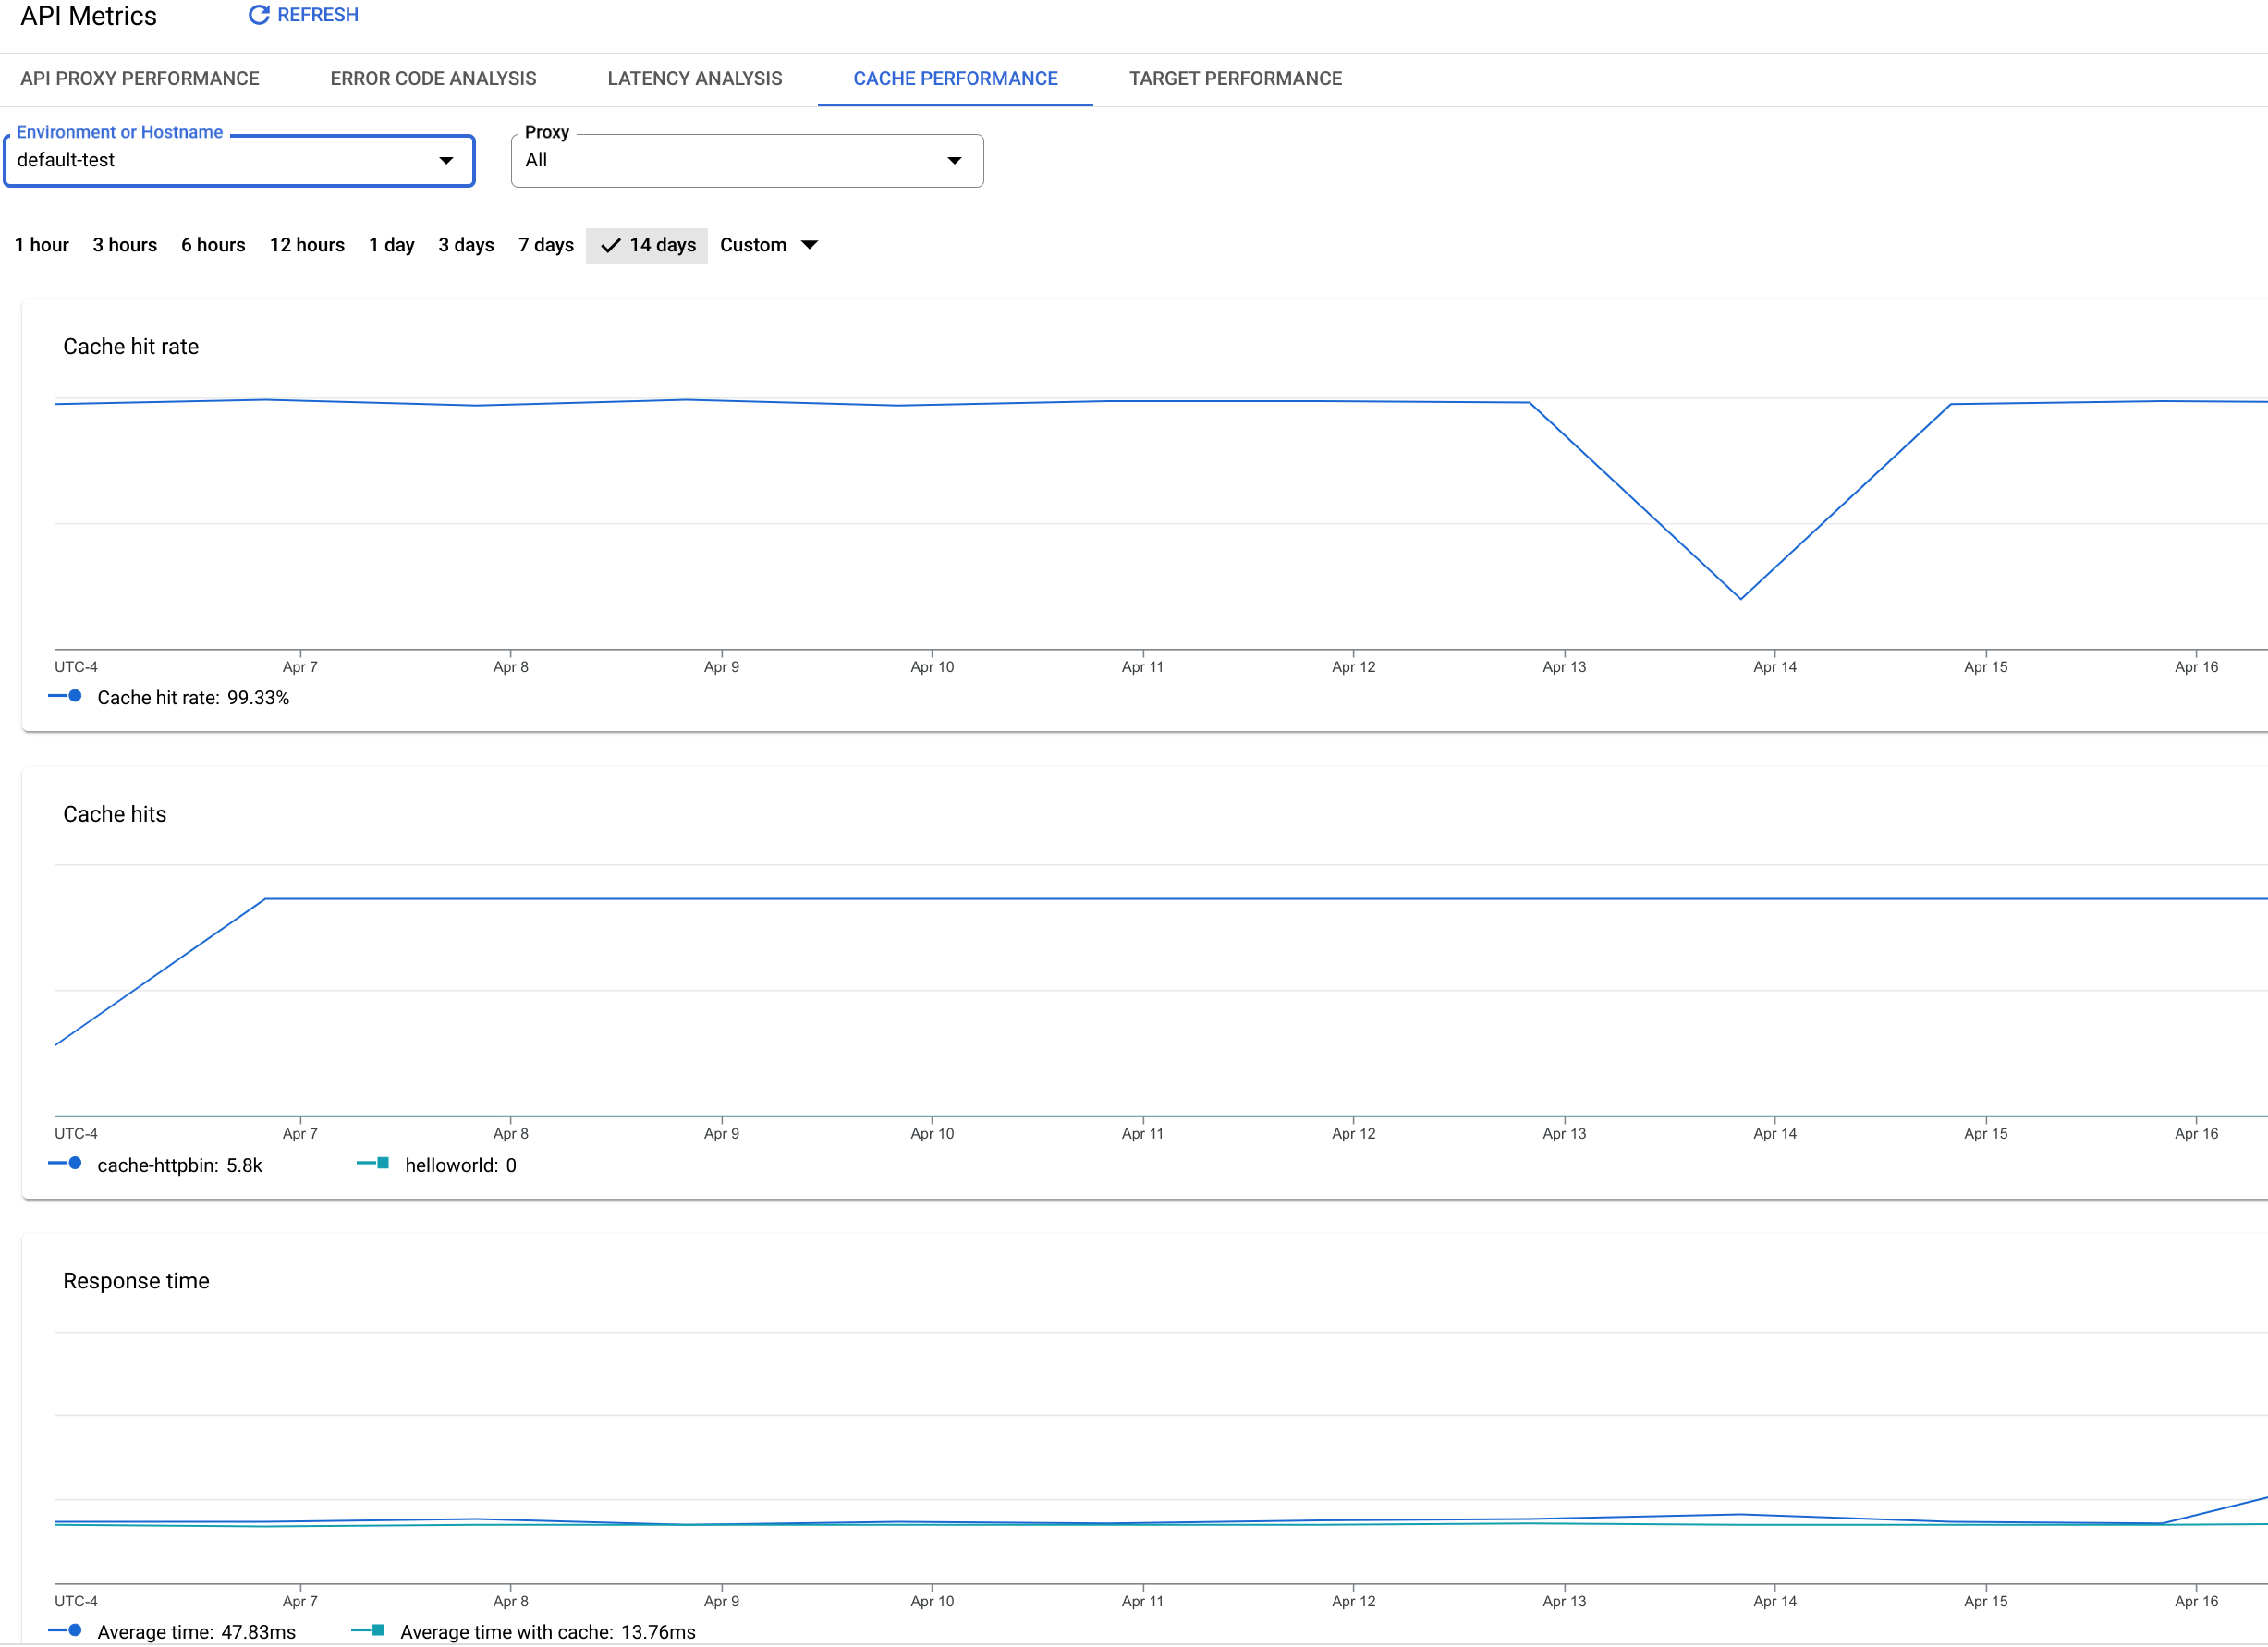
Le tableau de bord des performances du cache vous permet de rapidement consulter la valeur du cache de réponse.
Le tableau de bord vous aide à visualiser les avantages du cache de réponse en termes de latence réduite et de réduction de la charge des serveurs backend.
Le tableau de bord des performances du cache
Pour accéder au tableau de bord des performances du cache :
Dans la console Google Cloud , accédez à la page Analytics > Métriques d'API > Performances du cache.
Le taux d'appels en correspondance avec le cache mesuré par rapport au trafic total de l'API.
Succès de cache par proxy d'API
Somme des appels en correspondance avec le cache, répartie par proxy d'API.
Temps moyen avec cache
La durée moyenne d'un appel d'API en correspondance avec le cache.
Temps moyen sans cache
La durée moyenne d'un appel d'API sans correspondance avec le cache.
Sauf indication contraire, le contenu de cette page est régi par une licence Creative Commons Attribution 4.0, et les échantillons de code sont régis par une licence Apache 2.0. Pour en savoir plus, consultez les Règles du site Google Developers. Java est une marque déposée d'Oracle et/ou de ses sociétés affiliées.
Dernière mise à jour le 2025/09/04 (UTC).
[[["Facile à comprendre","easyToUnderstand","thumb-up"],["J'ai pu résoudre mon problème","solvedMyProblem","thumb-up"],["Autre","otherUp","thumb-up"]],[["Difficile à comprendre","hardToUnderstand","thumb-down"],["Informations ou exemple de code incorrects","incorrectInformationOrSampleCode","thumb-down"],["Il n'y a pas l'information/les exemples dont j'ai besoin","missingTheInformationSamplesINeed","thumb-down"],["Problème de traduction","translationIssue","thumb-down"],["Autre","otherDown","thumb-down"]],["Dernière mise à jour le 2025/09/04 (UTC)."],[[["\u003cp\u003eThis page focuses on the Cache Performance dashboard within Apigee and Apigee hybrid.\u003c/p\u003e\n"],["\u003cp\u003eThe dashboard visualizes the effectiveness of the ResponseCache policy, but not LookupCache or PopulateCache policies.\u003c/p\u003e\n"],["\u003cp\u003eYou can access the Cache Performance dashboard through the Apigee UI in the Cloud console or the classic Apigee UI.\u003c/p\u003e\n"],["\u003cp\u003eThe dashboard measures metrics like average cache hit rate, cache hits by API proxy, and average time with and without the cache.\u003c/p\u003e\n"],["\u003cp\u003eData in the dashboard may take up to 10 minutes to appear after API calls, and performance ratios may be temporarily inaccurate with new data.\u003c/p\u003e\n"]]],[],null,["# Cache performance dashboard\n\n*This page\napplies to **Apigee** and **Apigee hybrid**.*\n\n\n*View [Apigee Edge](https://docs.apigee.com/api-platform/get-started/what-apigee-edge) documentation.*\n\nWhat does this dashboard tell me?\n---------------------------------\n\nThe Cache Performance dashboard collects data from the\n[ResponseCache policy](/apigee/docs/api-platform/reference/policies/response-cache-policy).\nThis dashboard does not collect data from the [LookupCache](/apigee/docs/api-platform/reference/policies/lookup-cache-policy)\nor [PopulateCache](/apigee/docs/api-platform/reference/policies/populate-cache-policy) policies.\n\nThe Cache Performance dashboard lets you see at a glance the value of the response cache.\nThe dashboard helps you visualize the benefit of the response cache in terms of lower latency and reduced\nload backend servers.\n\n\n| **Note:** **Data delay interval** \n| After API calls are made to proxies, it may take up to **10 minutes** for the data to appear in dashboards, custom reports, and management API calls.\n\n\u003cbr /\u003e\n\nThe Cache Performance dashboard\n-------------------------------\n\nTo access the Cache Performance dashboard:\n\nIn the Google Cloud console, go to the **Analytics \\\u003e API metrics \\\u003e Cache Performance** page.\n\n[Go to Cache Performance](https://console.cloud.google.com/apigee/analytics/cache-performance)\n\n\u003cbr /\u003e\n\nThe **Cache Performance** view is shown:\n\nWhat does this dashboard measure?\n---------------------------------\n\n| **Note:** The performance ratios may appear incorrect for the first few minutes for new data. This is because with a small number of data points, there can be a difference in the number of data points being compared to create the ratios. This inconsistency will resolve itself within a few minutes as it collects more data points. If the performance ratios still appear incorrect, refresh the page."]]